One window a day — Nasdaq at the New York open
Max. drawdown −26.60 % Risk per trade 1.00 % Trades 1,792 · 4.4/week
Monthly returns outlined: forward test (live)
Free backtest file after signing in
In our Reels we test popular trading ideas in 60 seconds. That's too short to show all the work — so here is the complete study behind each video: the exact rules, every number and every chart. Check it yourself.
Every idea gets the same fair test: it is judged on years of data it has never seen, it pays real trading costs, and it has to do better than random trades. If it can't beat random, it was luck.
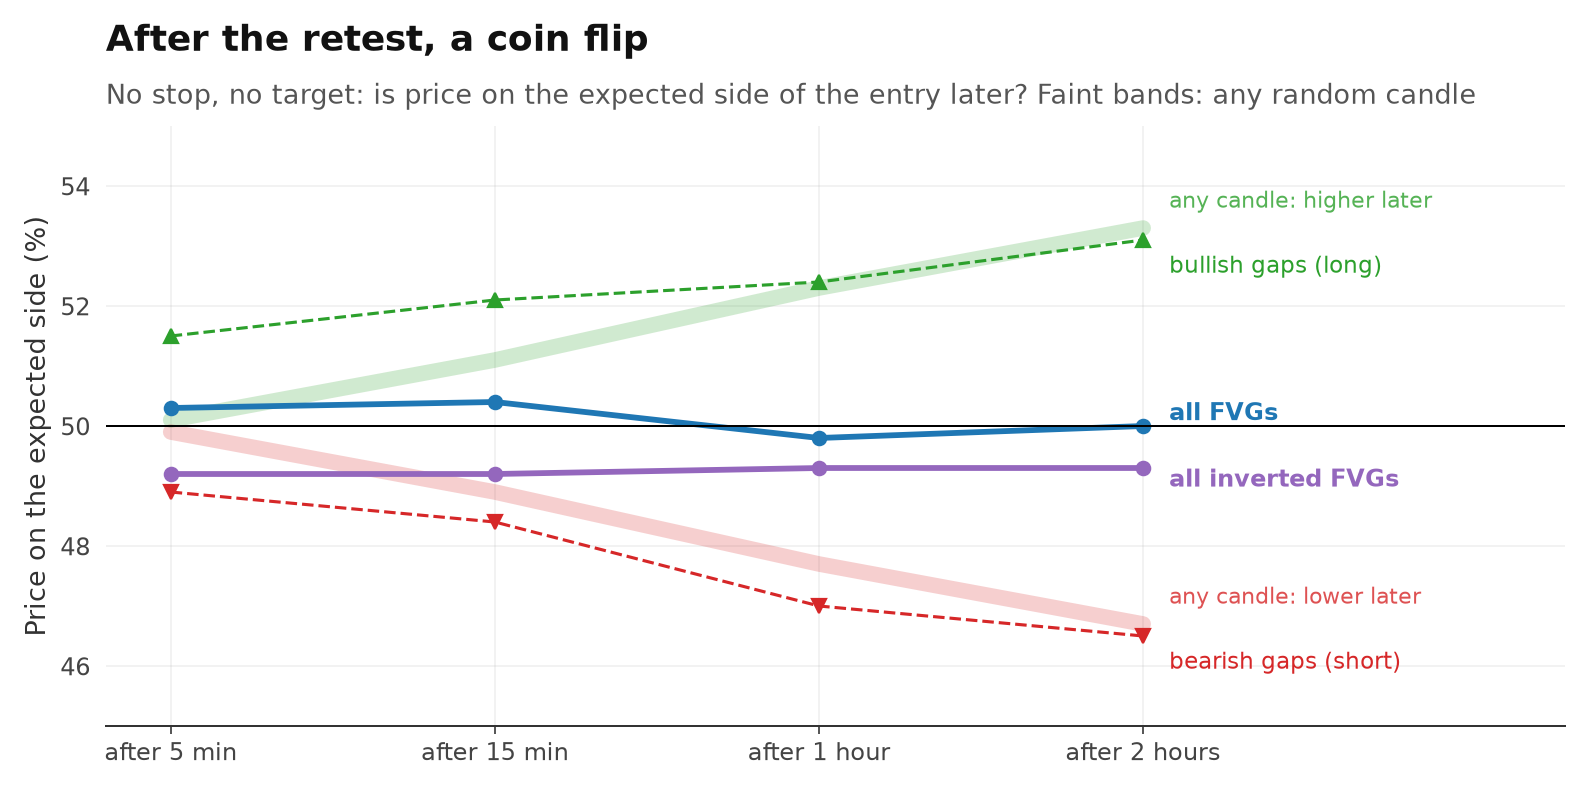
Fair value gaps and inverted gaps on six and a half years of Nasdaq 5-minute data. Regular gaps beat random limit orders by a hair, far too little to pay the costs; inverted gaps did not even do that.
Read the study →
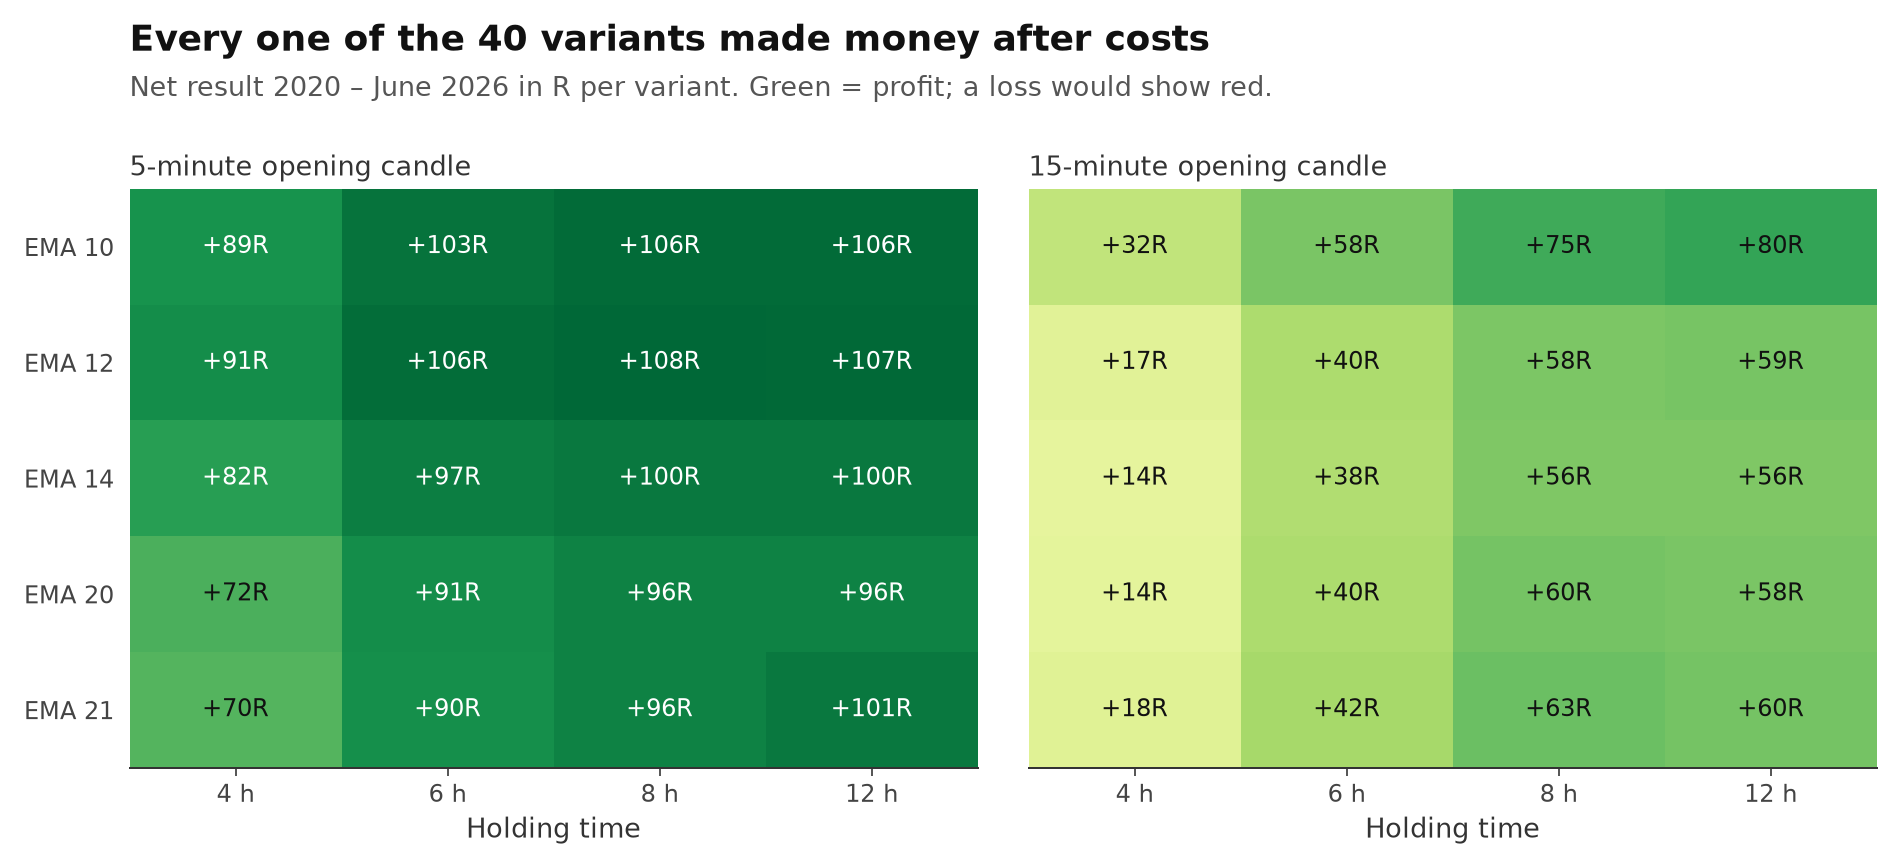
The first candle after the New York open, in 40 variants and against random trades. All 40 stayed profitable on 2024–2026 data they had never seen.
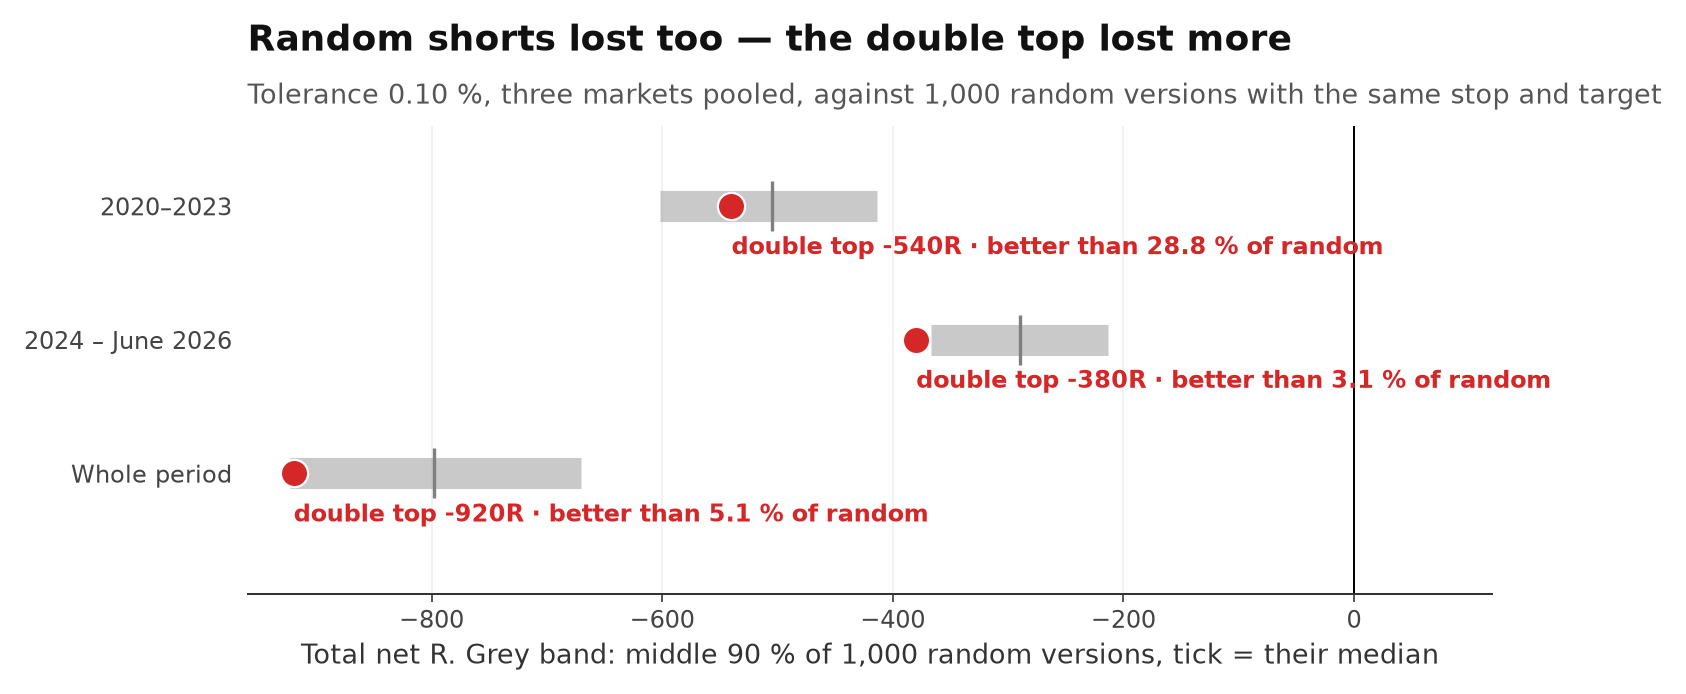
Two highs, a neckline, a break — as exact rules on three markets. The pattern lost money and did worse than random shorts with the same stop and target.
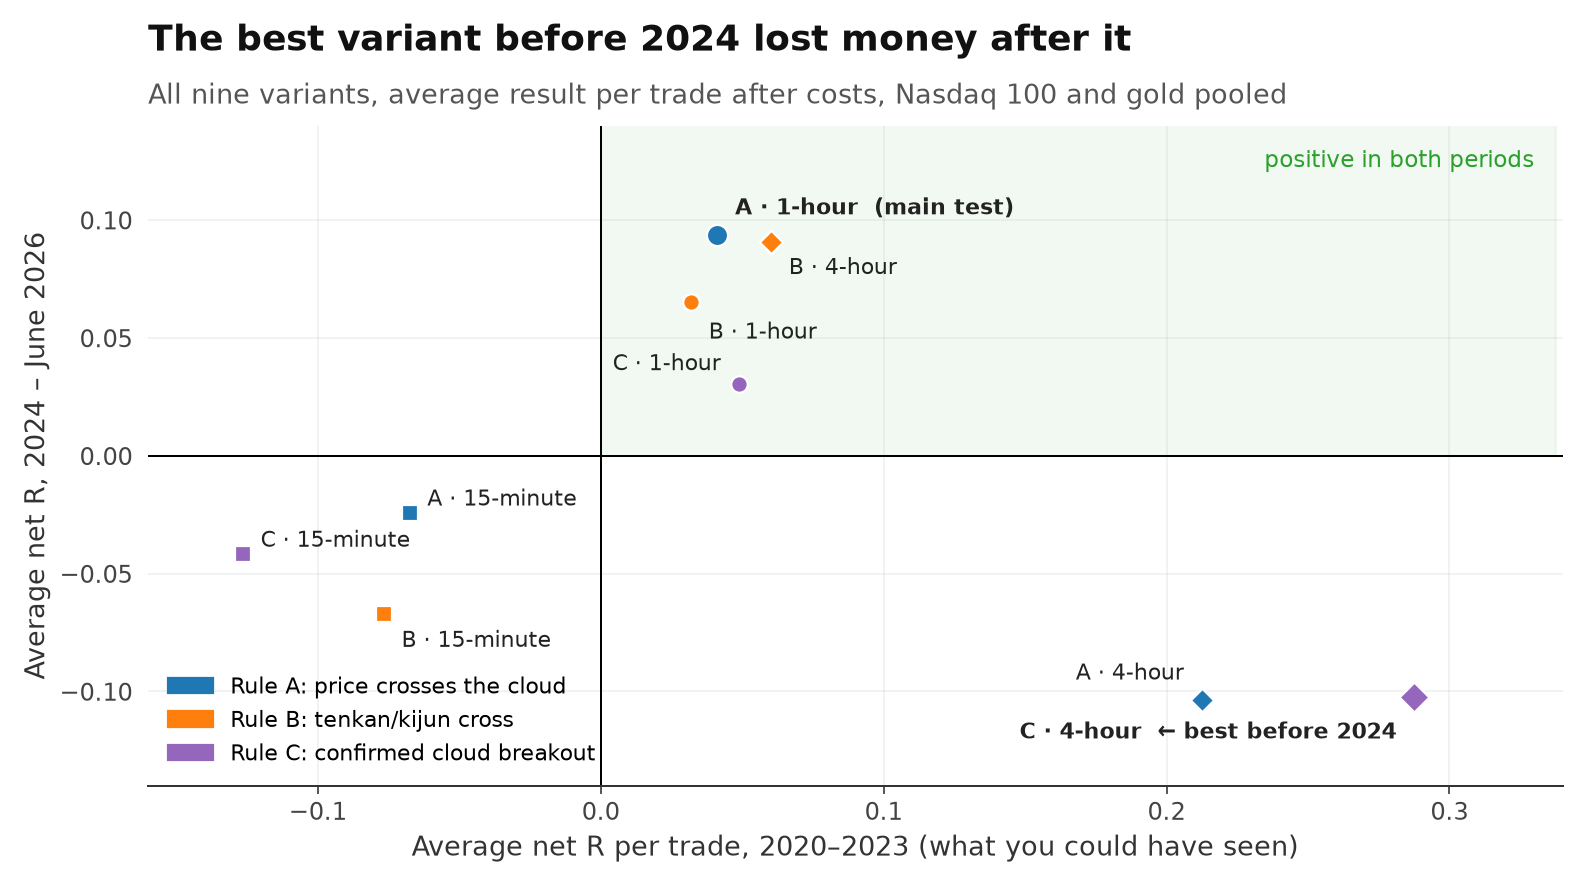
Nine Ichimoku rules on the Nasdaq and gold. The plain 1-hour cloud breakout stayed ahead of random after 2024, but not by enough to rule out luck — and the variant that looked best before lost money.
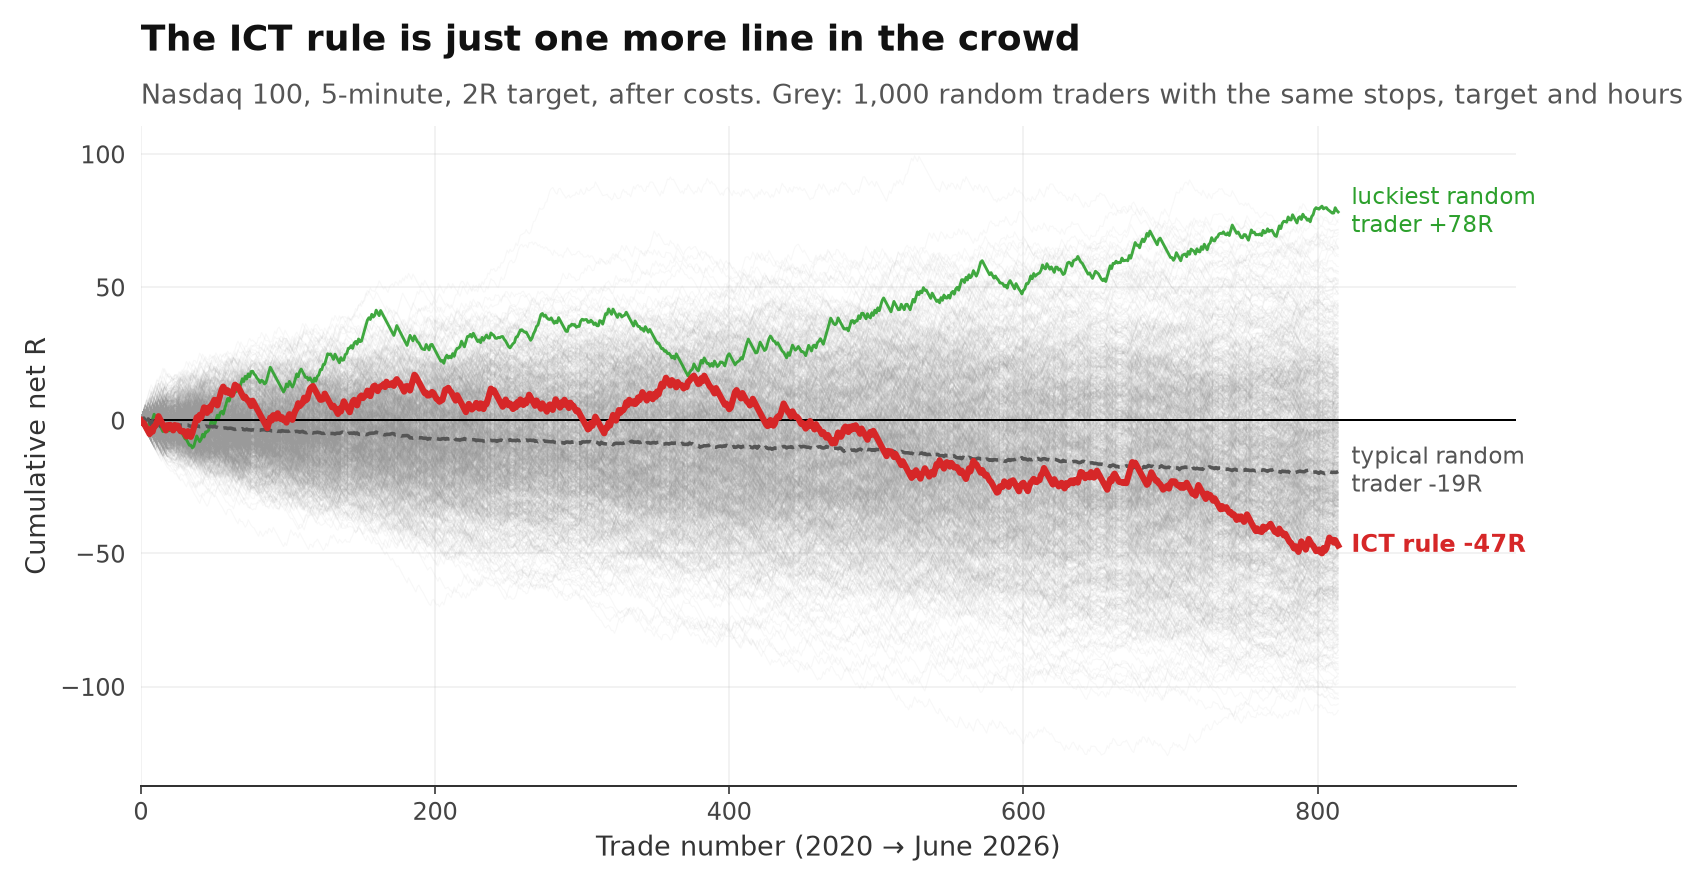
Liquidity sweep plus fair value gap on the Nasdaq, 2020–2026. Luck made plenty of winners — the ICT rule wasn't one of them.
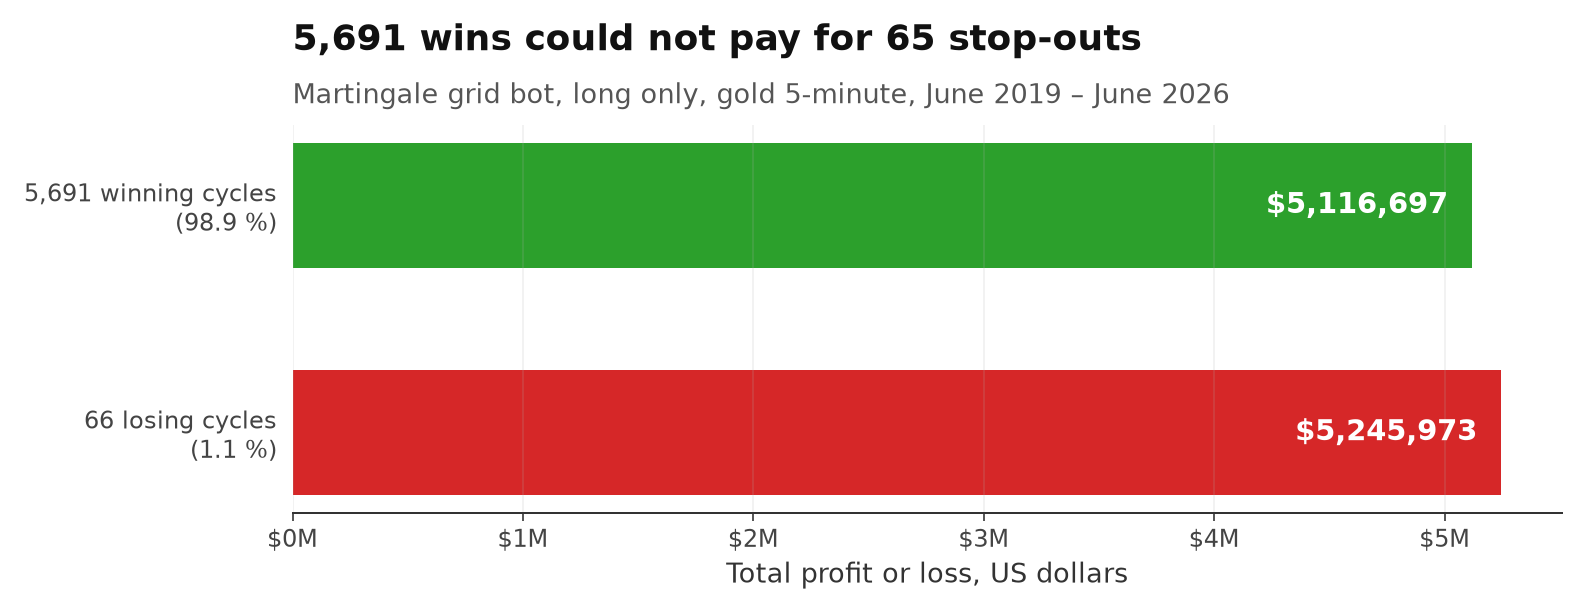
A grid bot that won 98.9 % of its cycles on gold still lost money and blew 14 accounts — the win rate hid the risk.
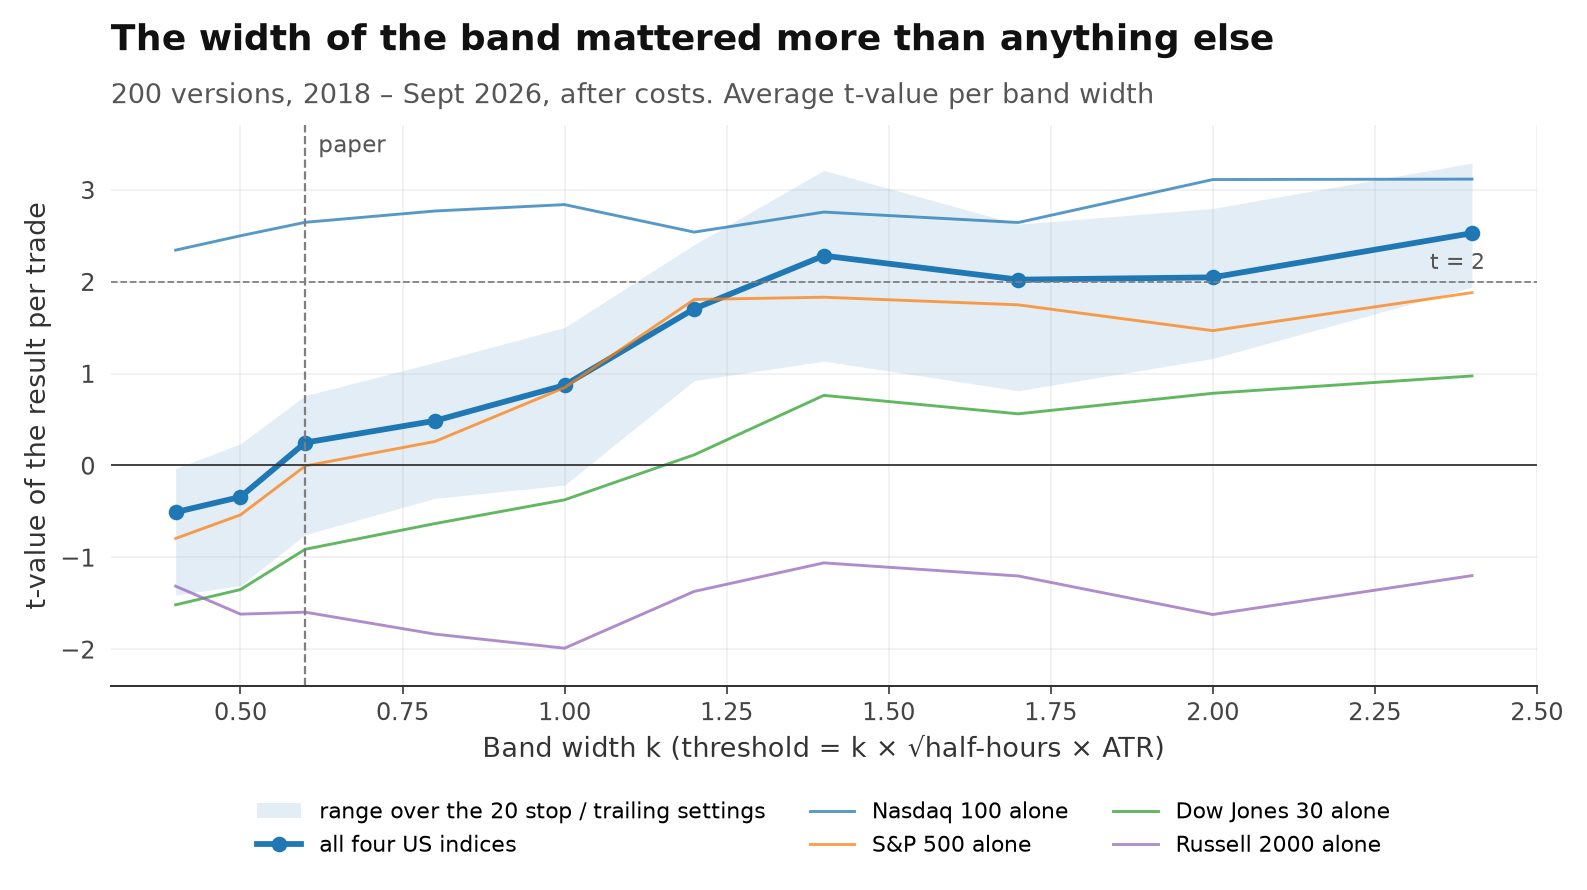
196 papers, 50 rule–market pairs, 2 survivors. The Noise Band was one of them — but only with a band about twice as wide as the paper's.
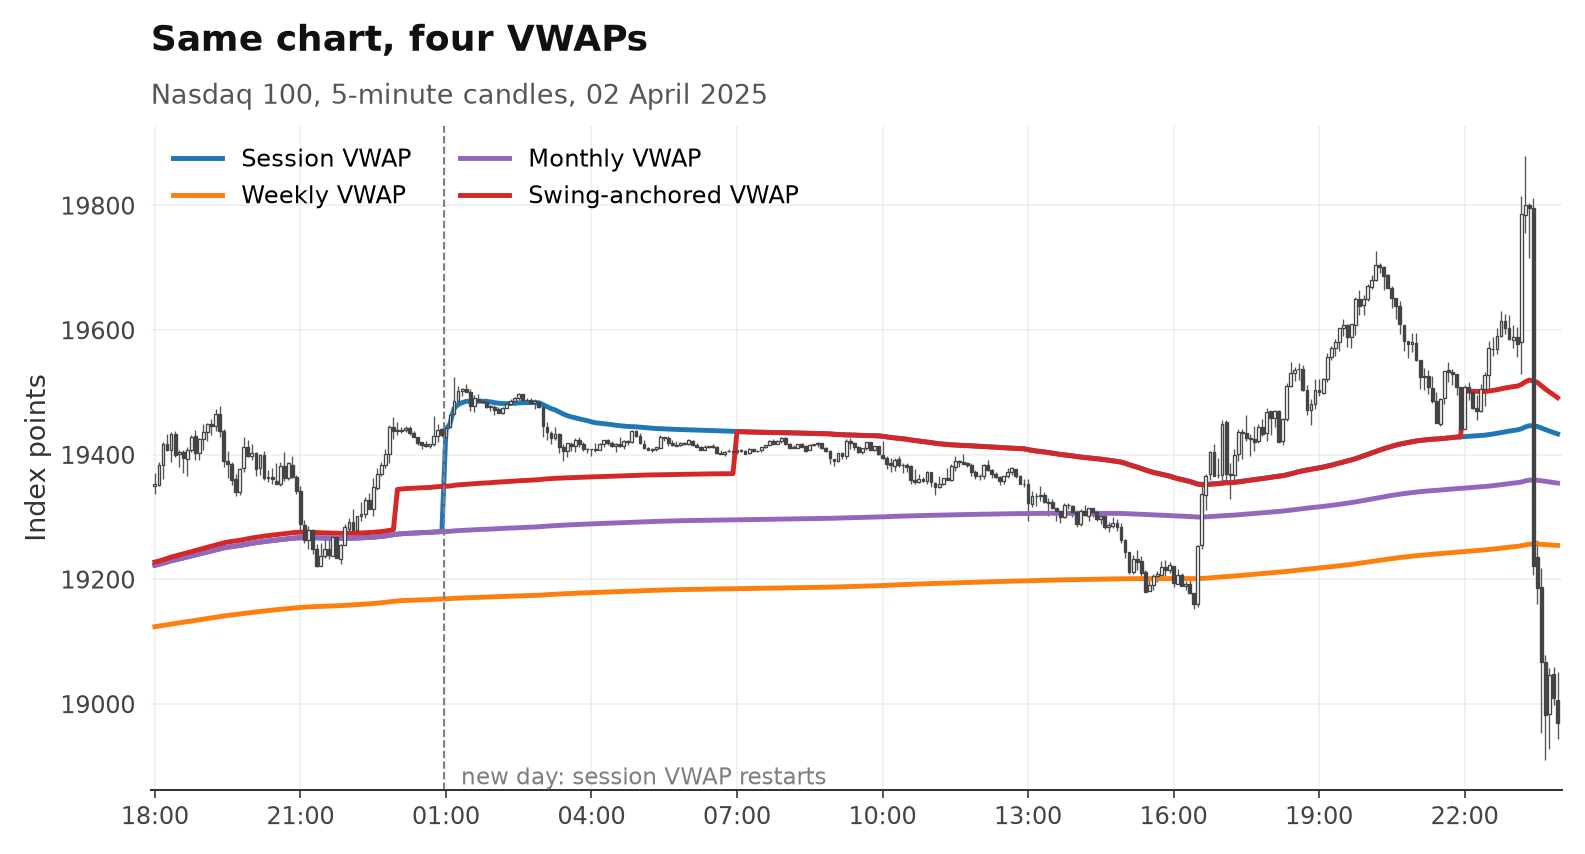
96 VWAP rules on the Nasdaq and S&P 500. Only 8 beat random entries — about what luck alone would give.
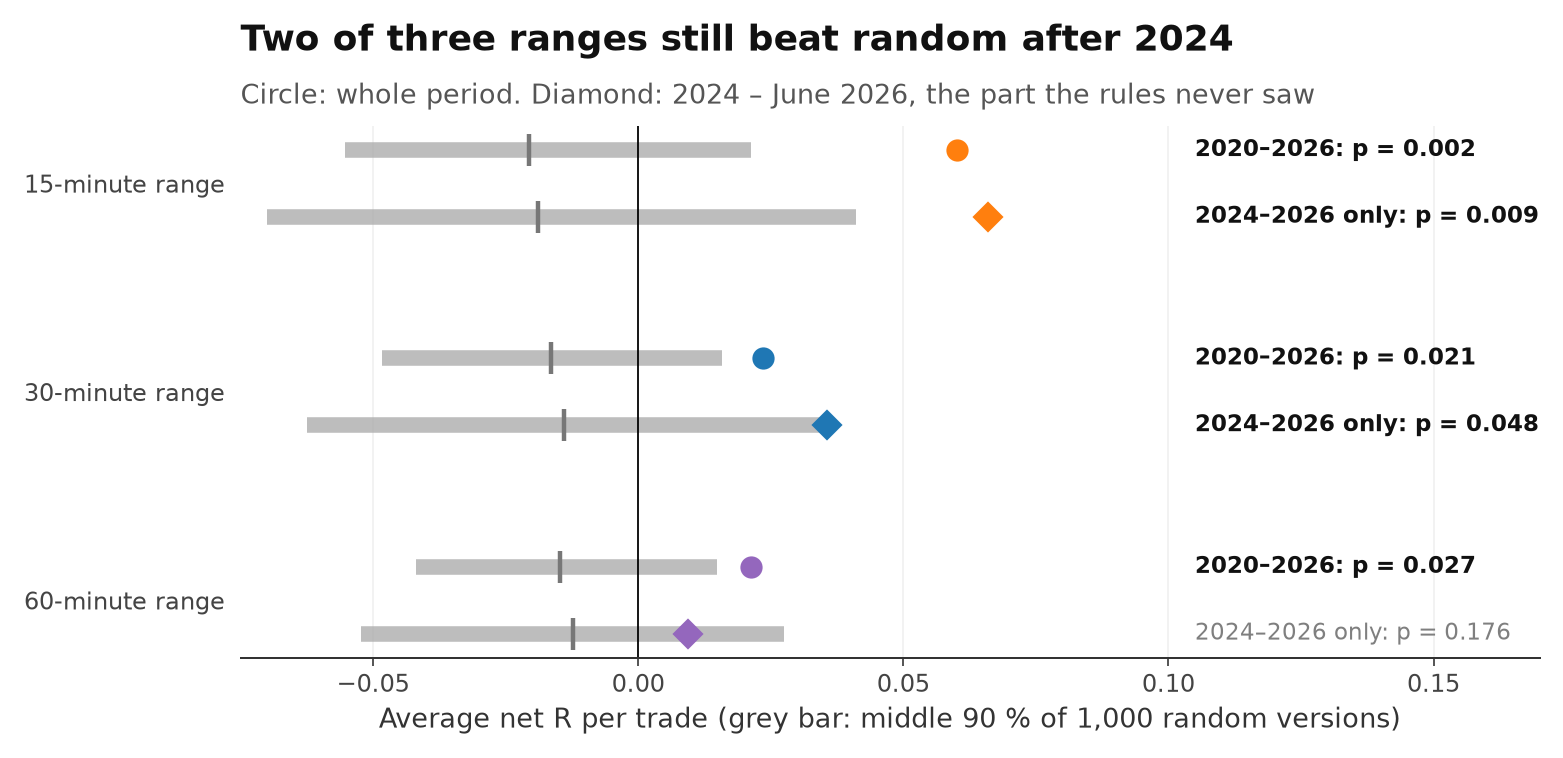
15, 30 and 60-minute ranges after the US open on the Nasdaq. All three beat random entries, two held up after 2024 — but the edge is small.
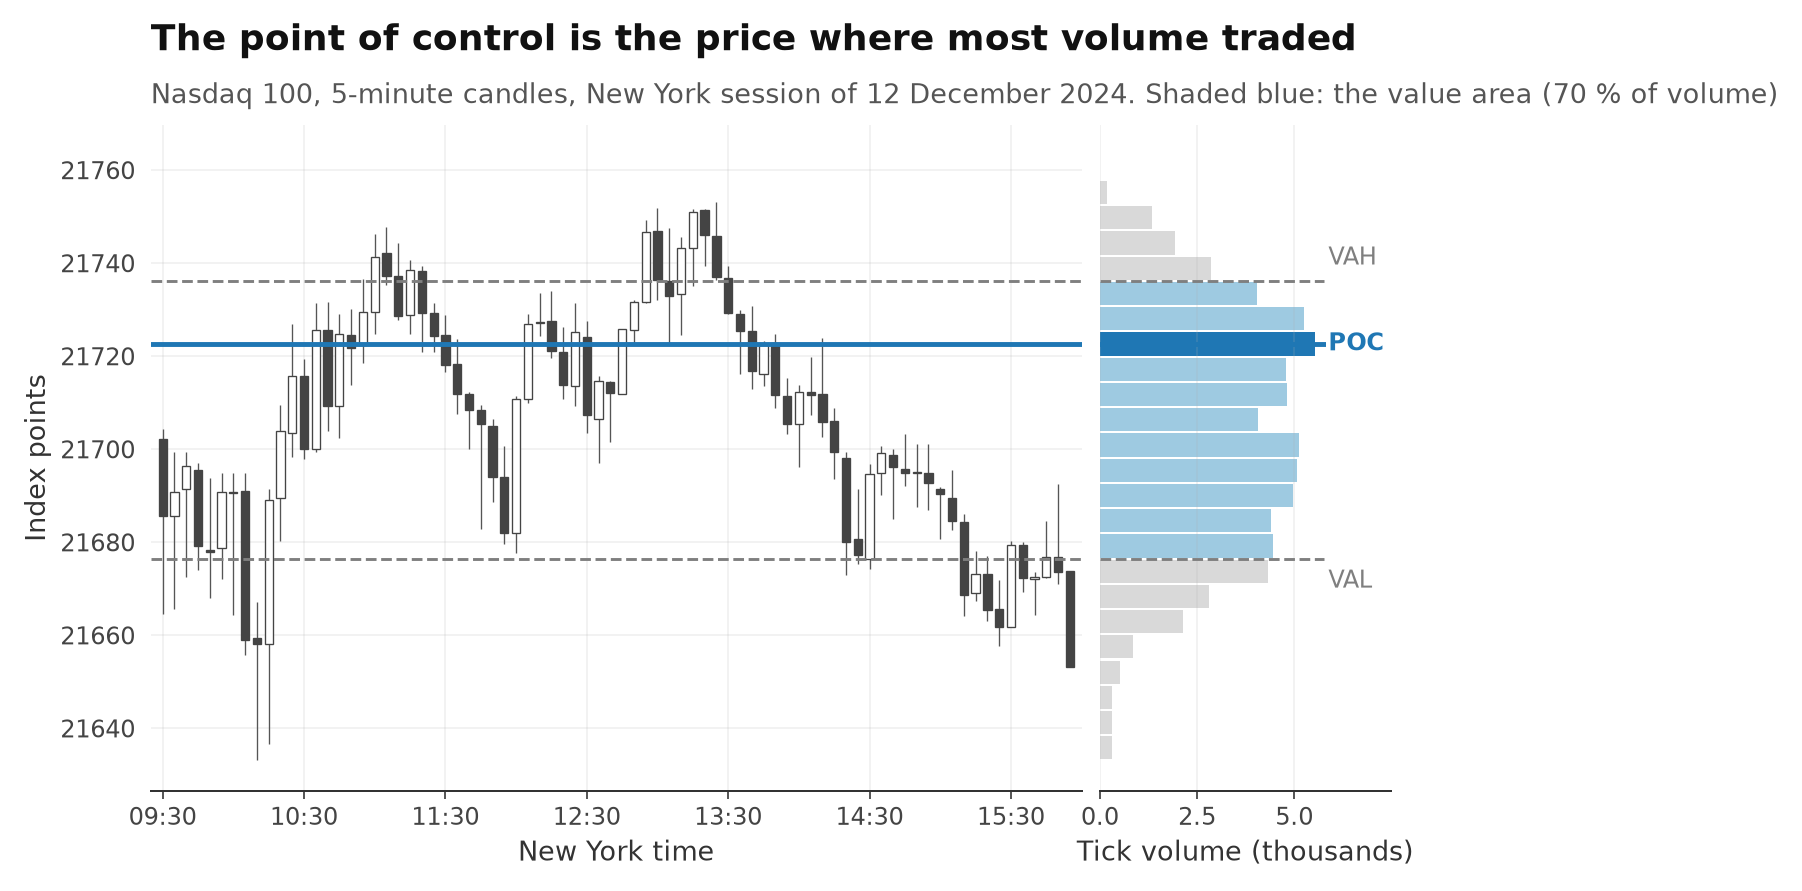
The POC pulls price a little more than a random level (55.2 % vs 52.6 %), but trading the return to it made only +0.009R per trade over 1,096 trades.
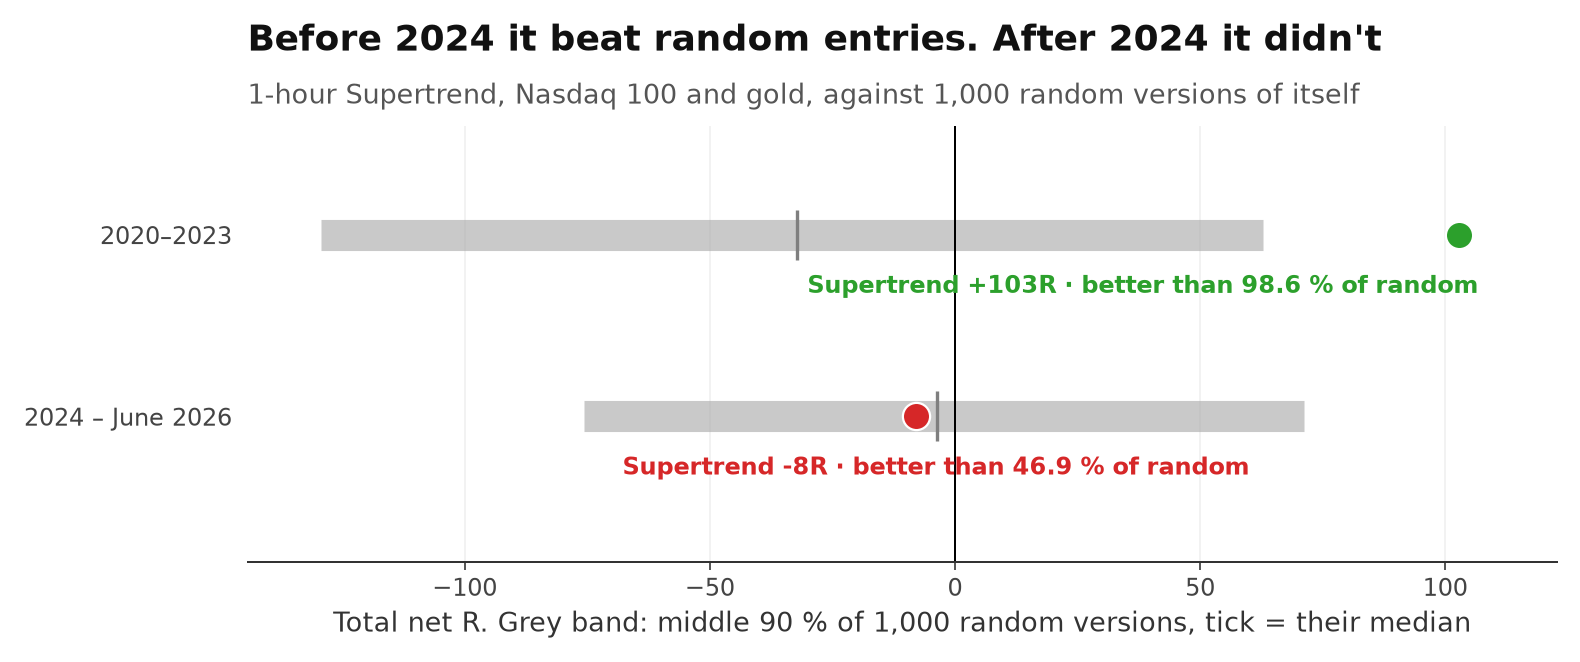
Standard Supertrend on the Nasdaq and gold, three timeframes. The 1-hour version beat random entries until 2024 — then did no better than a coin flip.
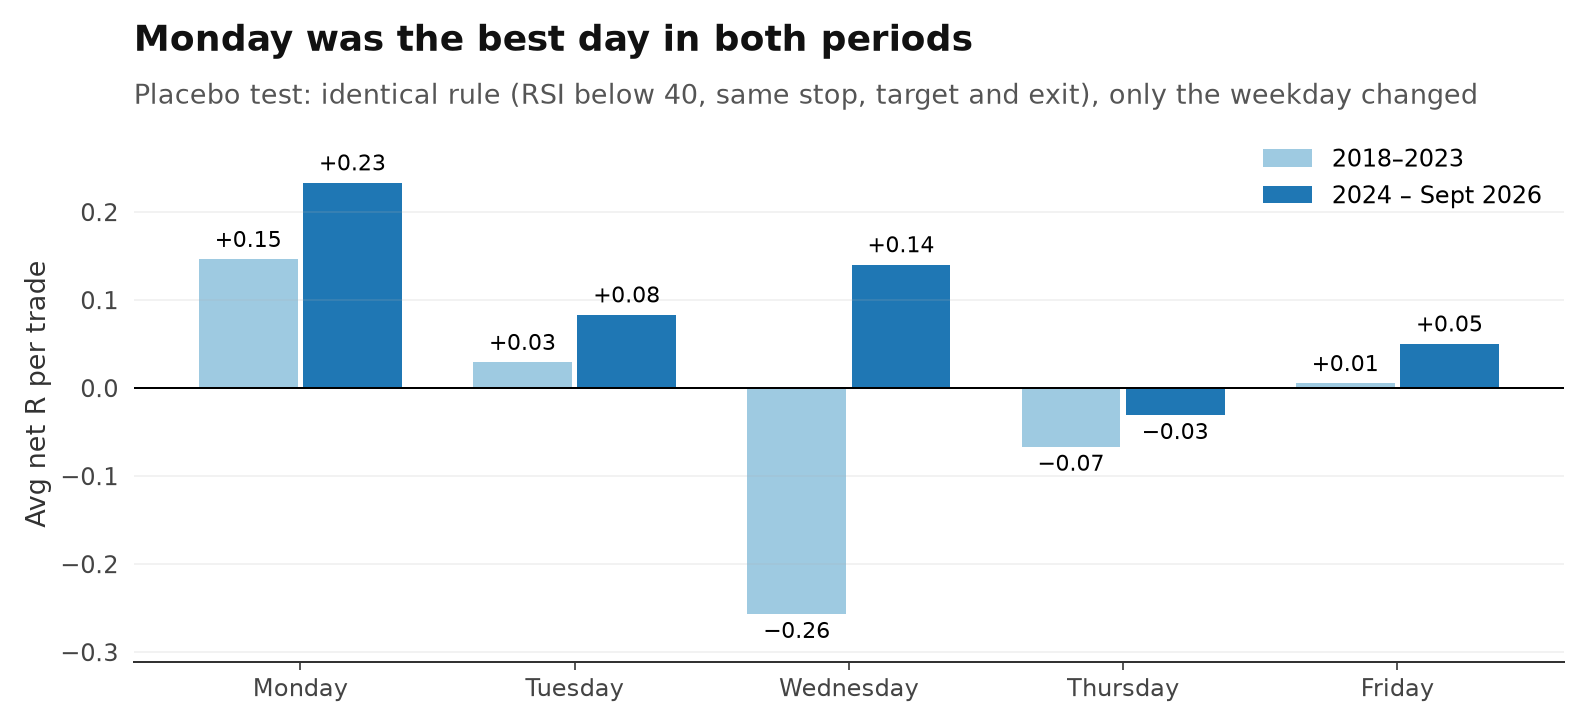
Two rules from our UK100 bot, tested against random entries, other weekdays and other indices. The Monday dip held up; the post-drop rebound is thin.
Studies in progress — picked from the questions asked most under our Reels.
Talk to other traders, ask questions and discuss the studies — free on Telegram.
Same process as every study: exact rules, data they had never seen, real costs, compared against random trades. These are the systems that passed — and they trade live today, with every trade visible.
One window a day — Nasdaq at the New York open
Max. drawdown −26.60 % Risk per trade 1.00 % Trades 1,792 · 4.4/week
Free backtest file after signing in
Three strategies on the FTSE 100: post-drop rebound, Monday dip and pullbacks in the trend – with loss streak defense
Max. drawdown −12.03 % Risk per trade 0.75 % Trades 1,908 · 3.8/week
Free backtest file after signing in
Three gold strategies in one EA: momentum, a fourth-quarter breakout and the turn of the month
Max. drawdown −14.09 % Risk per trade 0.75 % Trades 1,309 · 3.2/week
Free backtest file after signing in
EMA cross on NAS100, in four parts — with 12.5 months of forward testing.
Max. drawdown −28.98 % Risk per trade 1.50 % Trades 1,528 · 2.8/week
Or join our free algo trading community on Telegram — talk to other traders and ask your questions.