Does the Monday dip actually work on the FTSE 100?
Our Reel explained two rules from our UK100 system: buy weakness on Mondays, and buy the snap-back after a sharp drop. We tested both on 1,062 FTSE 100 trades since 2018 — against random entries, against the other weekdays and on three other indices.
01The idea
Weakness at the start of the week tends to get bought. And when the index falls too far, too fast, it tends to snap back.
The FTSE 100 often opens the week soft. News from the weekend, positions closed on Friday, a slow Monday morning. The idea behind the Monday dip: when the index is weak on a Monday, buy it, and give it one day to recover.
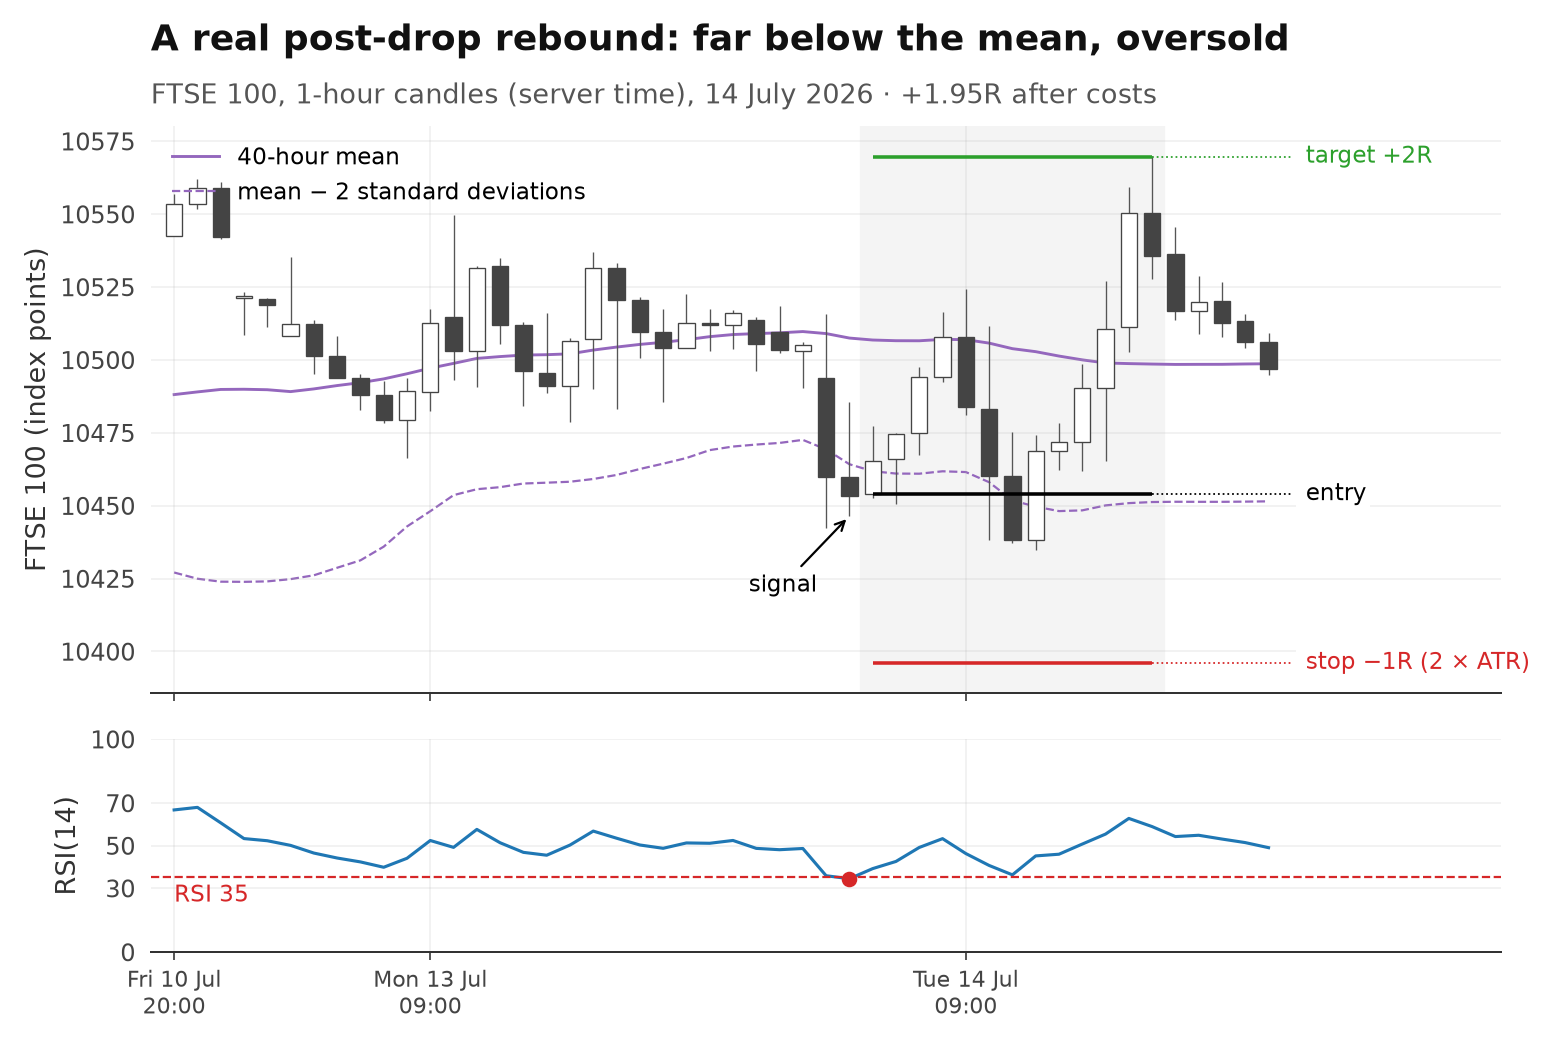
The second rule, the post-drop rebound, works on any day. It waits for a sharp, unusual drop — far below the recent average and oversold — and buys the bounce.
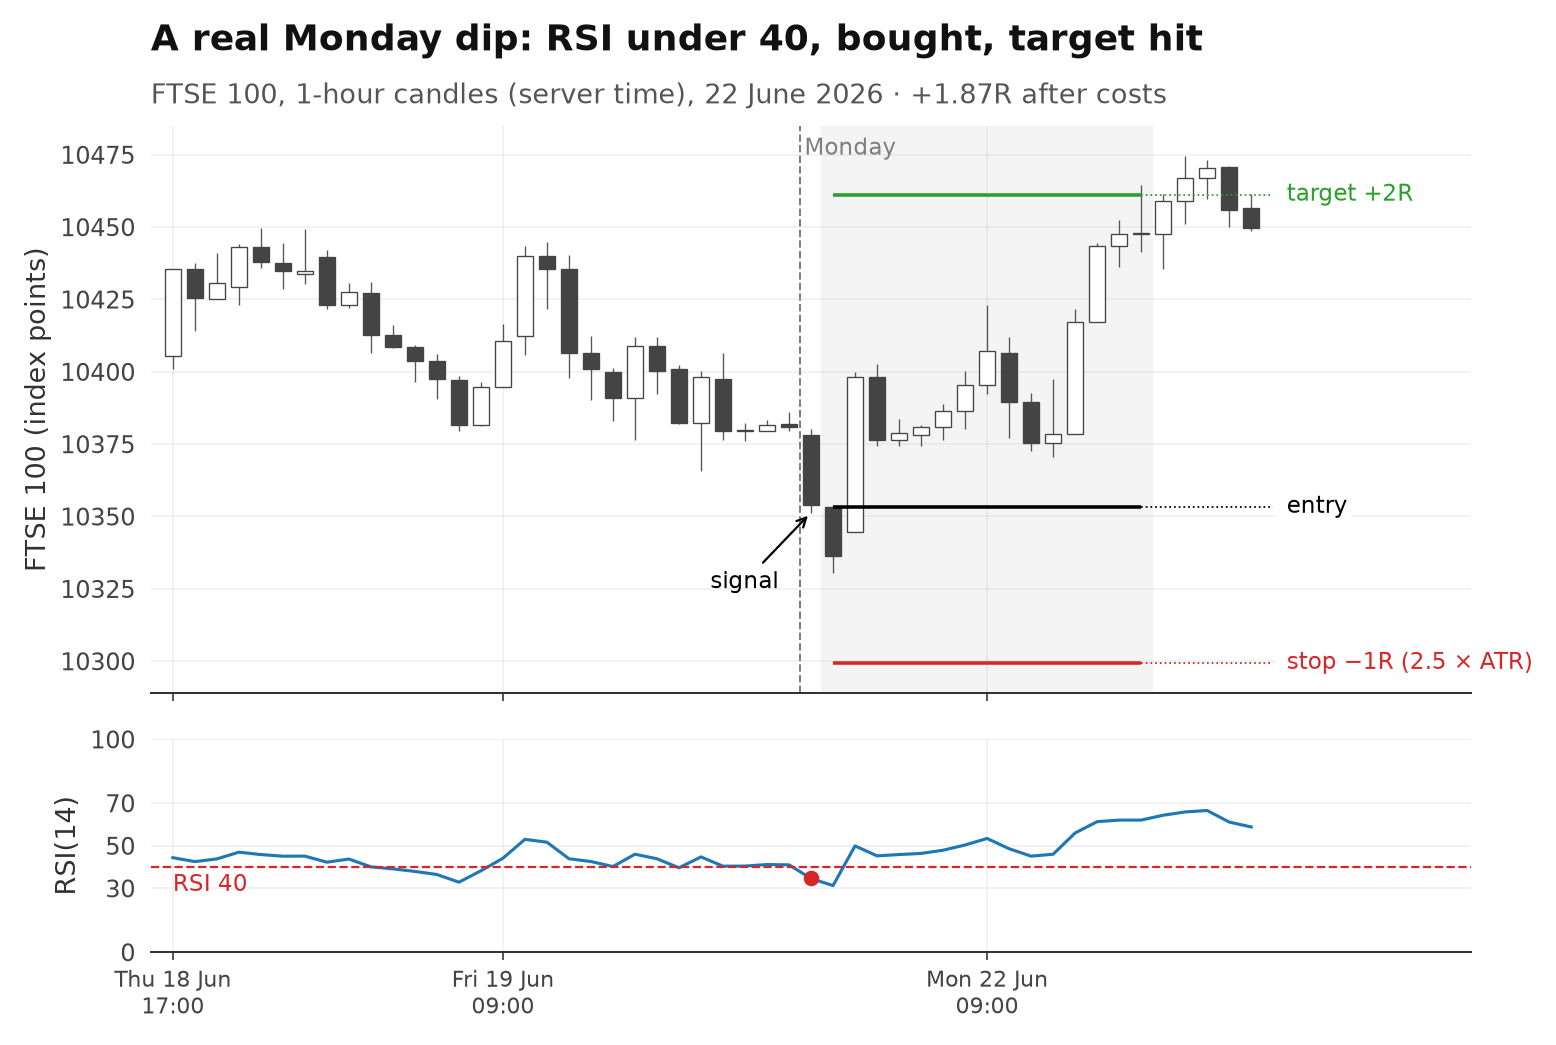
Both rules are part of our UK100 system, together with a third rule (a pullback in the trend) that this study does not cover. That is exactly why we tested them harder than a Reel can show.
02The exact rules
Long only, one-hour candles, both rules exactly as they run in the system.
| Monday dip | Post-drop rebound | |
|---|---|---|
| Day | Monday only | Any day |
| Signal | RSI(14) below 40, and price at least 0.3 standard deviations below its 20-hour mean | Price more than 2 standard deviations below its 40-hour mean, RSI(14) below 35, and a drop of more than one ATR over the last 6 hours |
| Stop | 2.5 × ATR(14) | 2 × ATR(14) |
| Target | 2R | 2R |
| Time exit | After 24 one-hour candles, at the latest | |
The Reel left out one condition per rule, because it hardly matters. For the Monday dip, the "below the 20-hour mean" condition removed 1 of 1,295 signal candles — with RSI under 40, price is practically always below its mean. For the rebound, the 6-hour drop removed 83 of 2,200.
03How a trade is counted
The same mechanics as every study in this library. No discretion, no hindsight.
| Entry | Signal on a closed one-hour candle, entry at the open of the next candle |
|---|---|
| Risk | The distance to the stop is 1R. Typical stop: 51.7 index points for the Monday dip, 40.8 for the rebound |
| Worst case | If stop and target fall in the same candle, we count the stop. A gap through the stop fills at the open |
| One at a time | Each rule holds at most one position. A new signal only counts once the last trade is closed |
| Data | Our broker's FTSE 100 prices (UK100), 2018-01-01 to 2026-09-28, server time |
We measure in R, not money. +0.1R per trade means: on average you win a tenth of what you risk.
The target is rarely what ends a Monday dip trade: 16 % reached 2R, 38 % hit the stop, and 47 % were closed by the time exit — mostly with a small gain or loss.
04Costs
Every trade pays the spread plus 0.5 points slippage — and the spread depends on the hour.
Our broker's FTSE 100 spread is about 1 point during the London session, but several points at night. So each trade pays the typical spread of its entry hour (measured on 2024–2026 prices) plus 0.5 points slippage: 1.52 points in the London session, up to 7.02 points around midnight.
That matters here: 36 % of Monday dip trades start outside the London session, many right after the weekend open. Still, against a typical stop of 52 points, a typical trade costs about 4 % of its risk. Costs took 24 % of the Monday dip's profit and 42 % of the rebound's.
05Results
Both rules made money after costs. The Monday dip made far more per trade, with a third of the trades.
| 2018 – Sept 2026, after costs | Trades | Win rate | Net | Per trade | Profit factor | Worst drawdown |
|---|---|---|---|---|---|---|
| Monday dip | 285 | 53.3 % | +49.8R | +0.175R | 1.4 | 10.0R |
| Post-drop rebound | 777 | 42.9 % | +54.5R | +0.070R | 1.12 | 20.4R |
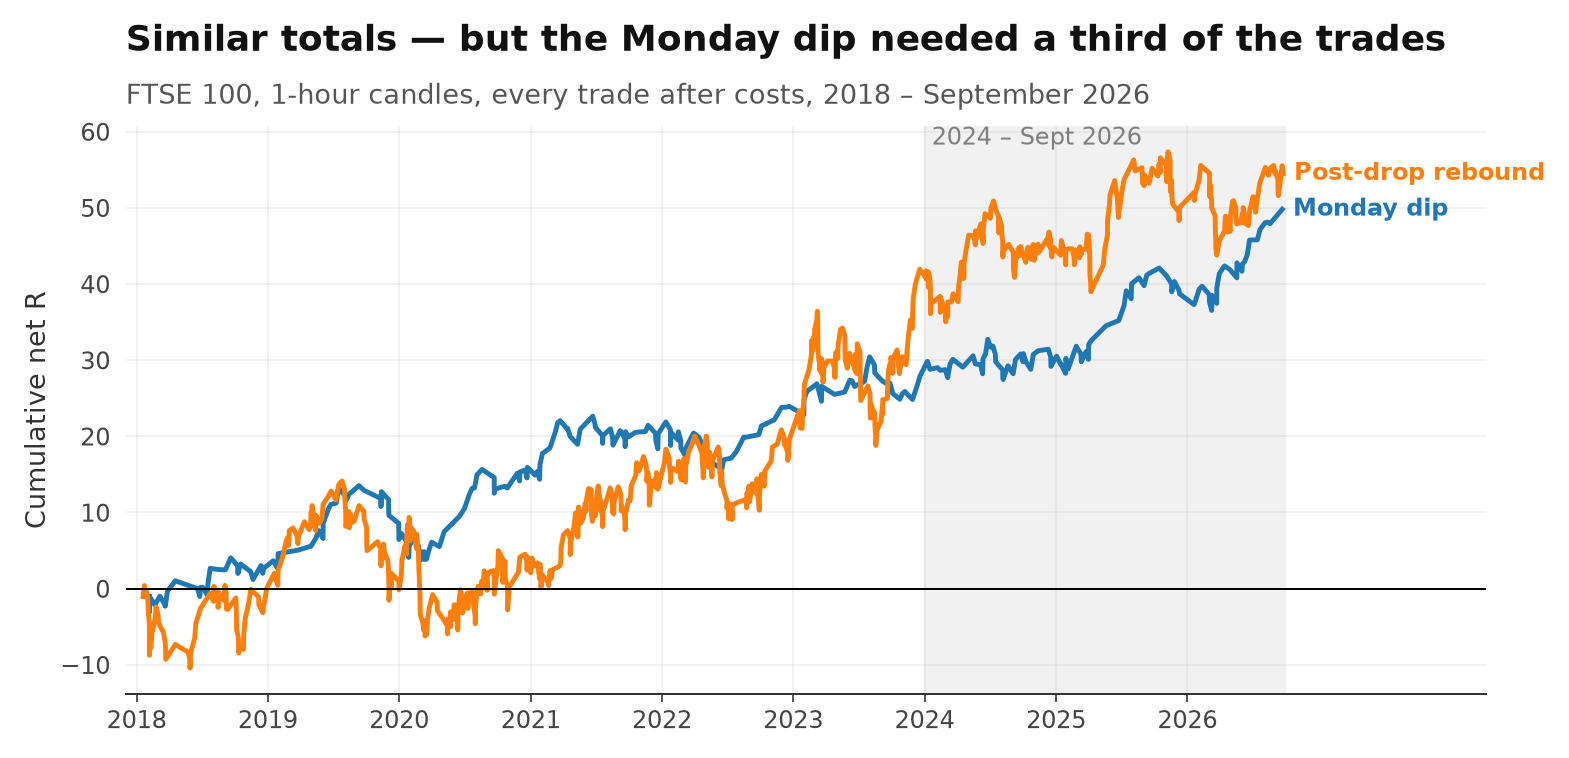
The Monday dip was positive in every calendar year from 2018 to 2026. The rebound had a flat 2018–2019 and earned most of its profit in 2021 and 2023.
06The random test
Buying the FTSE 100 at random is not free money. Both rules did clearly better than that.
"It made money" proves little on its own — a market that drifts up rewards almost any long trade. So each rule was compared with 1,000 random copies of itself: same number of trades, long, same hour of the day, but on a random other day of the same month, with the same stop rule, the same 2R target, the same time exit and the same costs.
p = 0.05 means 1 in 20 random copies did as well as the rule. The lower, the less likely it's luck. With 1,000 copies, 0.001 is the lowest possible value.
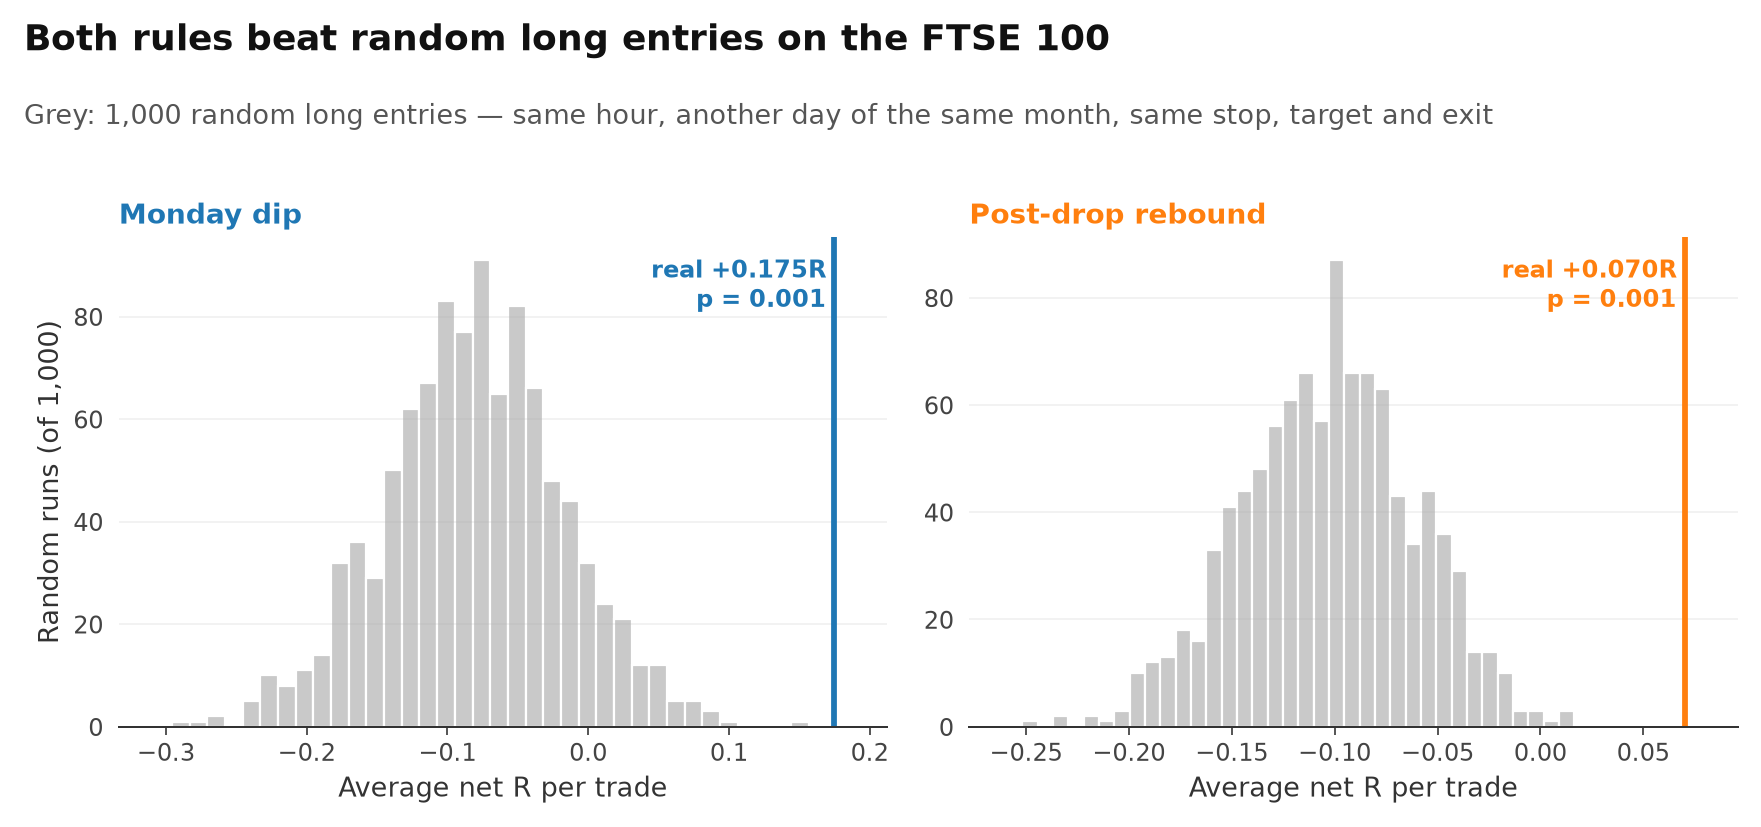
The typical random copy lost −0.081R per trade (Monday dip) and −0.101R (rebound). The real rules made +0.175R and +0.070R. Not one random copy did as well — p = 0.001 for both.
One more check for the Monday dip: is it just "buy on Mondays"? We compared it with random entries on other Mondays of the same year at the same hour. Those made −0.037R per trade on average; the RSI condition still beat all 1,000 of them (p = 0.001).
07Is it really Monday?
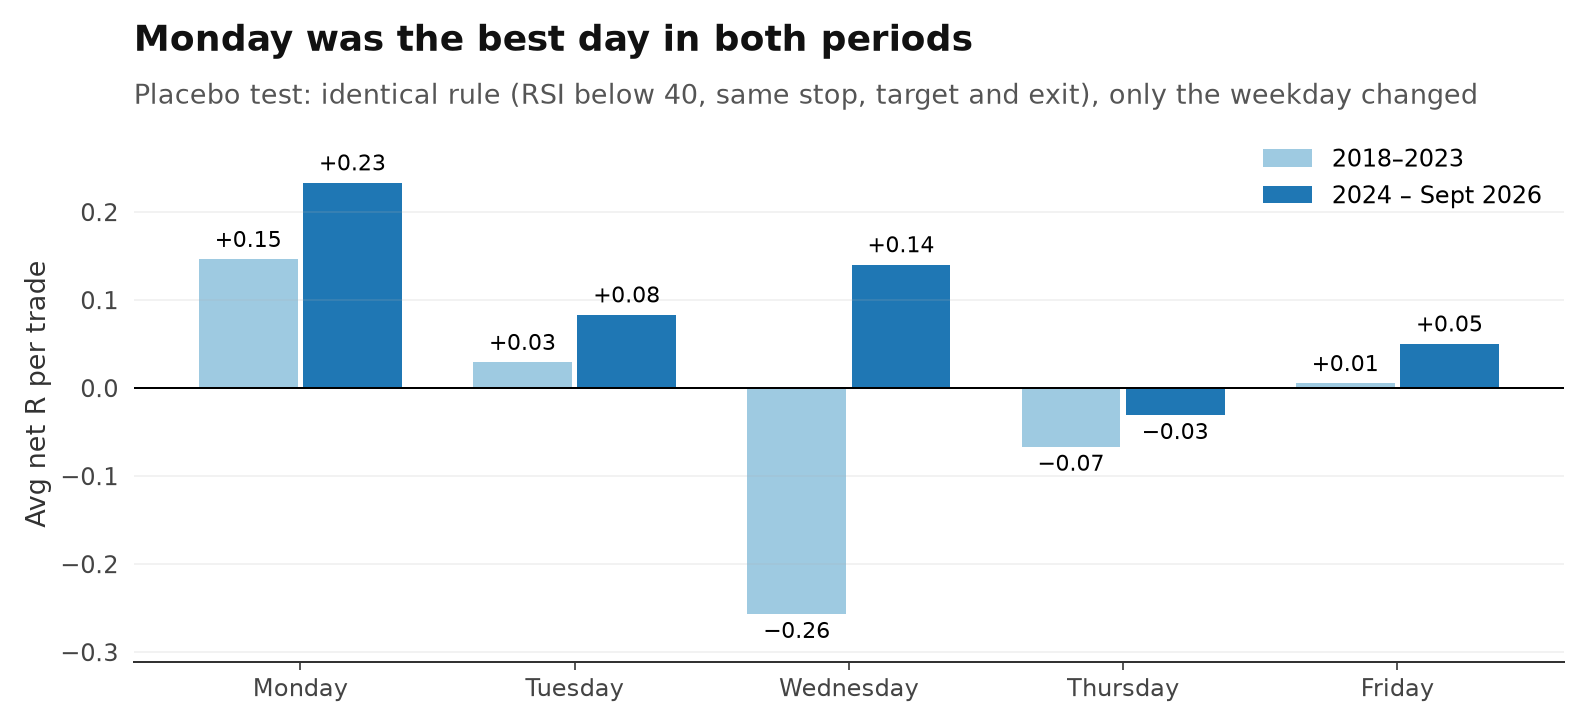
The identical rule on Tuesday to Friday did worse — in both halves of the test.
If the Monday dip only worked because buying dips works in general, the same rule should work just as well on any other day. So we ran it unchanged, only with a different weekday — a placebo test.
| Same rule, after costs | Trades | Per trade | Profit factor |
|---|---|---|---|
| Monday | 285 | +0.175R | 1.4 |
| Tuesday | 343 | +0.050R | 1.1 |
| Wednesday | 328 | −0.121R | 0.78 |
| Thursday | 392 | −0.056R | 0.89 |
| Friday | 354 | +0.020R | 1.04 |
Some other days made a little money too — dips in a rising index do tend to recover. But no other day came close to Monday: the best of them made +0.050R per trade, Monday +0.175R.
08Other indices
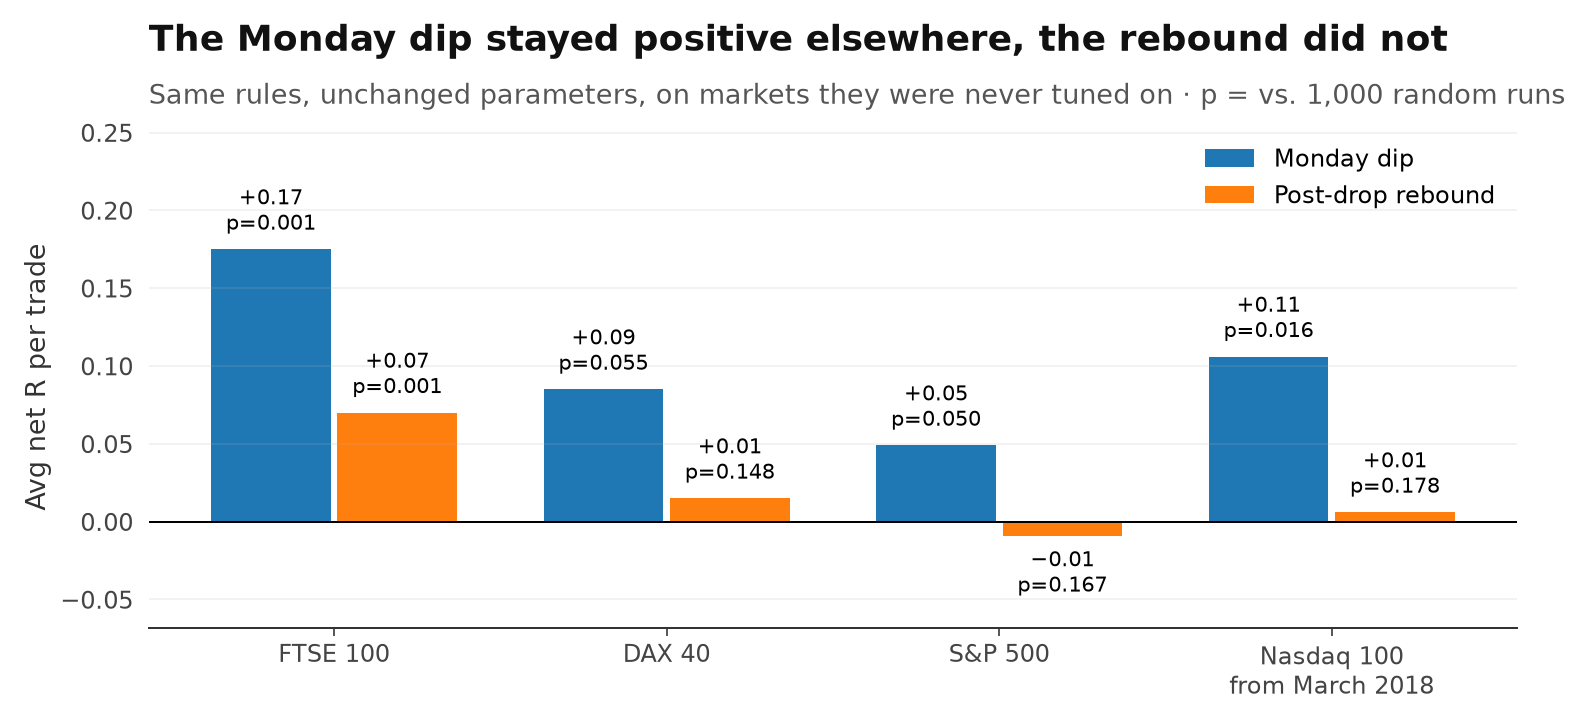
Unchanged, the Monday dip stayed positive on the DAX, the S&P 500 and the Nasdaq. The rebound did not.
The settings were tuned on the FTSE 100. If they only fit the noise of that one market, they should fail elsewhere. So we ran both rules, without changing a single number, on three other indices — with each market's own spread.
| After costs | Monday dip | p | Post-drop rebound | p |
|---|---|---|---|---|
| FTSE 100 | +0.175R | 0.001 | +0.070R | 0.001 |
| DAX 40 | +0.085R | 0.055 | +0.015R | 0.148 |
| S&P 500 | +0.049R | 0.050 | −0.009R | 0.167 |
| Nasdaq 100 | +0.106R | 0.016 | +0.006R | 0.178 |
The Monday dip was weaker away from the FTSE 100 — between +0.05R and +0.11R per trade — but positive on every index and at or near p = 0.05. That is what a real effect looks like when its settings came from another market. The rebound, by contrast, was roughly zero everywhere else.
09Lucky settings?
Move the Monday dip's settings around and it still works. The rebound is more fragile.
A rule tuned to one lucky number collapses as soon as you move it. So we changed two settings of each rule step by step — 25 combinations each — and looked at every result, not just the best one.
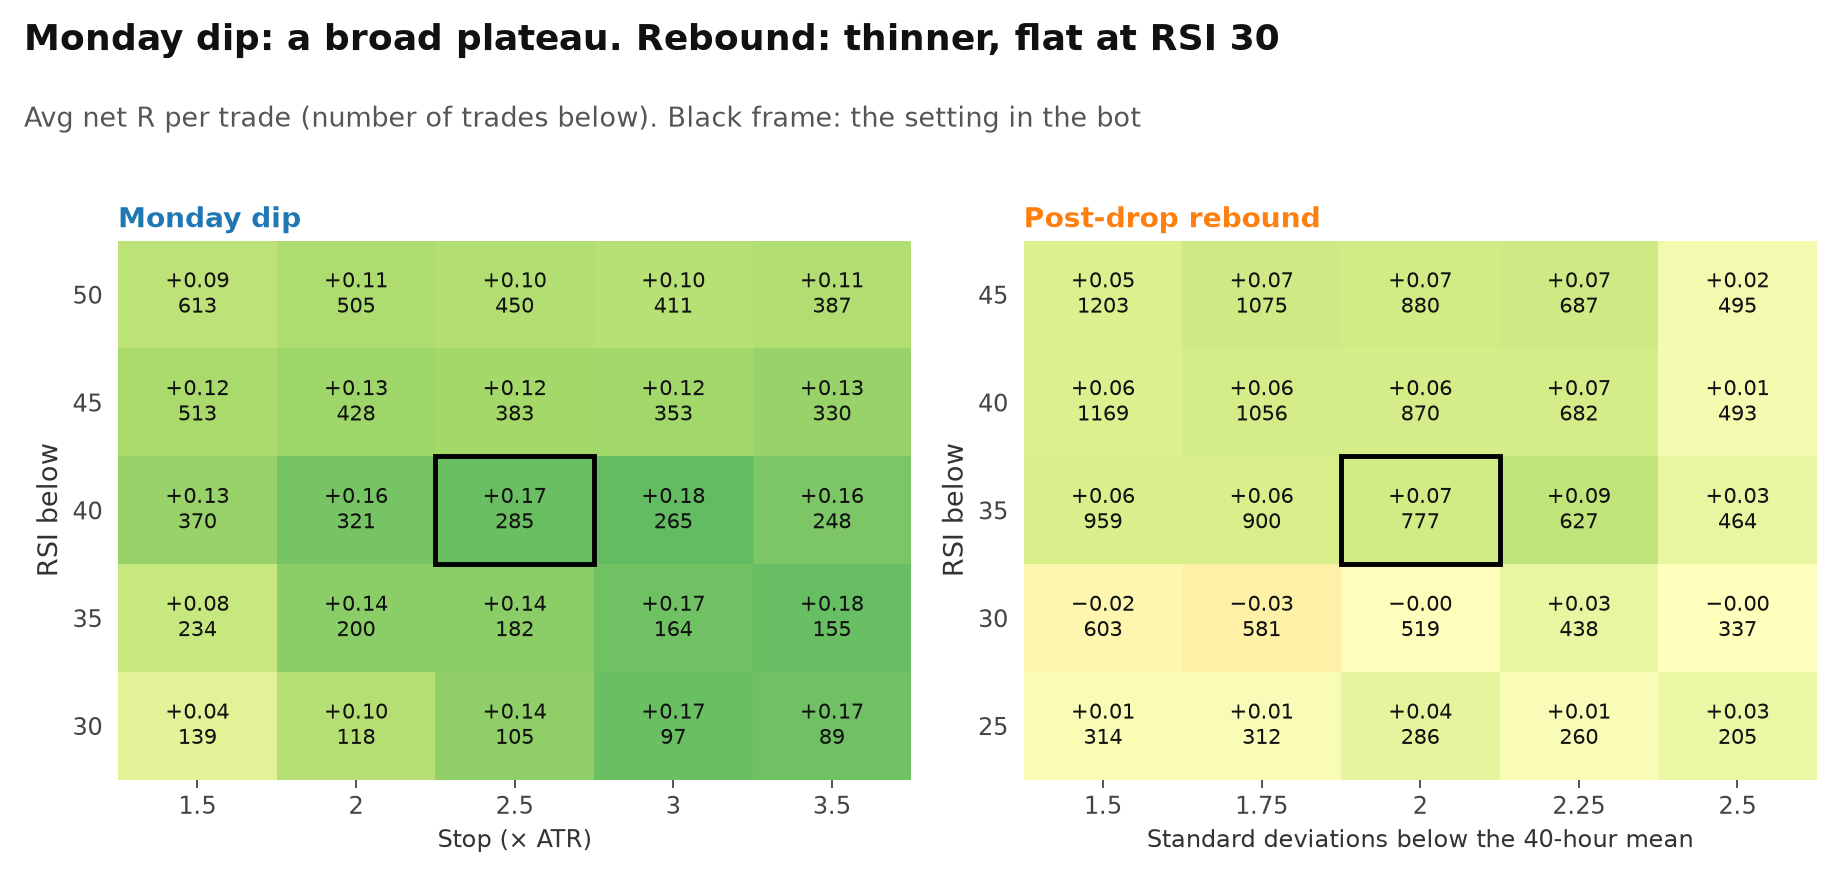
Monday dip: all 25 of 25 combinations were profitable after costs, from +0.04R to +0.18R per trade. The chosen setting sits on a plateau, not on a spike.
Post-drop rebound: 21 of 25 were positive, but only between −0.03R and +0.09R. Tighten the RSI from 35 to 30 and the edge is gone.
10Early vs. recent years
Both halves were positive. But this is not an out-of-sample test — the settings were chosen on both.
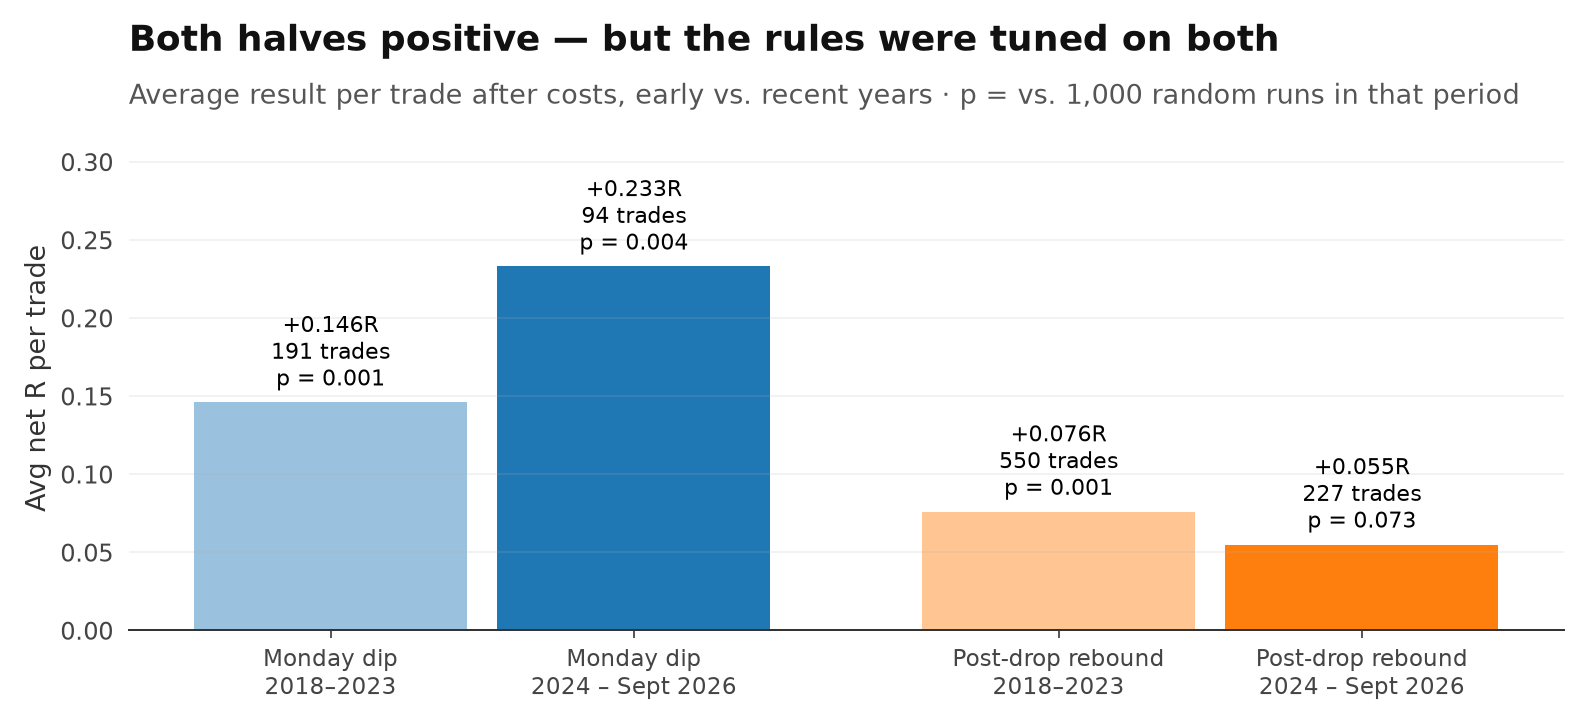
The Monday dip made +0.146R per trade in 2018–2023 and +0.233R in 2024–2026, and beat random in both (p = 0.001 and 0.004). The rebound fell from +0.076R to +0.055R, and after 2024 it no longer beat random (p = 0.073).
In our other studies, the rules were frozen before a test period they had never seen. Here they were not: the settings of our UK100 system were chosen on 2018–2026 data, so 2024–2026 was part of the tuning. Our broker's FTSE 100 history only starts in late 2017, so there was no older data left to test on. That is why the weekday placebo, the other indices and the plateau carry the weight here. The real out-of-sample test is live trading — and the system has only traded live since 19 September 2026. That is far too short to prove anything.
11Verdict
The Monday dip beat random entries, beat the same rule on every other weekday, stayed positive on three indices it was never tuned on, and sits on a broad plateau of settings. The post-drop rebound is positive on the FTSE 100, but thin.
So does the Monday dip work? On the evidence we have, the effect looks real — +0.17R per trade after costs is large for a simple rule. But keep the caveat in mind: no untouched test period, and only a short live record. And +0.17R on average still means 38 % of trades hit their stop.
The rebound is the weaker part. It added profit on the FTSE 100, but it did not survive the move to other markets, it did not beat random after 2024, and it depends on the exact RSI threshold. We say that openly, because it runs in our own system.
If you trade the Monday dip yourself
- Use a wide stop. 2.5 × ATR was tested; tighter stops earned less.
- Give it a day. Most trades ended on the 24-hour time exit, not at the target.
- Watch the spread at night. Many Monday signals come right after the weekend open, when the spread is widest.
- Expect losing streaks. The worst drawdown was 10.0R.
12Limitations
- No untouched out-of-sample period: the parameters were chosen on the same 2018–2026 data.
- One broker's FTSE 100 CFD prices; 2018 and 2019 have gaps in the hourly data.
- One-hour candles, no tick data. When stop and target fall in the same candle, the stop is counted.
- Spread history only exists from 2023; earlier years use the 2024–2026 spread of the same hour.
- The two rules are tested separately. In the system they share one account with a third rule, which changes position sizing and risk.
- The live record since 19 September 2026 is not part of this test.
The 60-second version
This study started as a Reel. The full rules and every check are above.
Next in the research library
- Do fair value gaps actually work? We tested almost 100,000 No usable edge
- Can one 5-minute candle predict the next six hours? Yes — the direction carries
- Does the double top pattern actually work? Worse than random
- Do Bollinger Bands actually predict reversals? in the lab
- Does Fibonacci actually work in trading? in the lab
- Does the weather in New York actually affect the Nasdaq? in the lab