Does the double top pattern actually work?
We turned the double top into exact rules and shorted every one on the Nasdaq 100, gold and EUR/USD — 5,871 trades — and compared the result with random shorts, before and after 2024.
01What a double top is
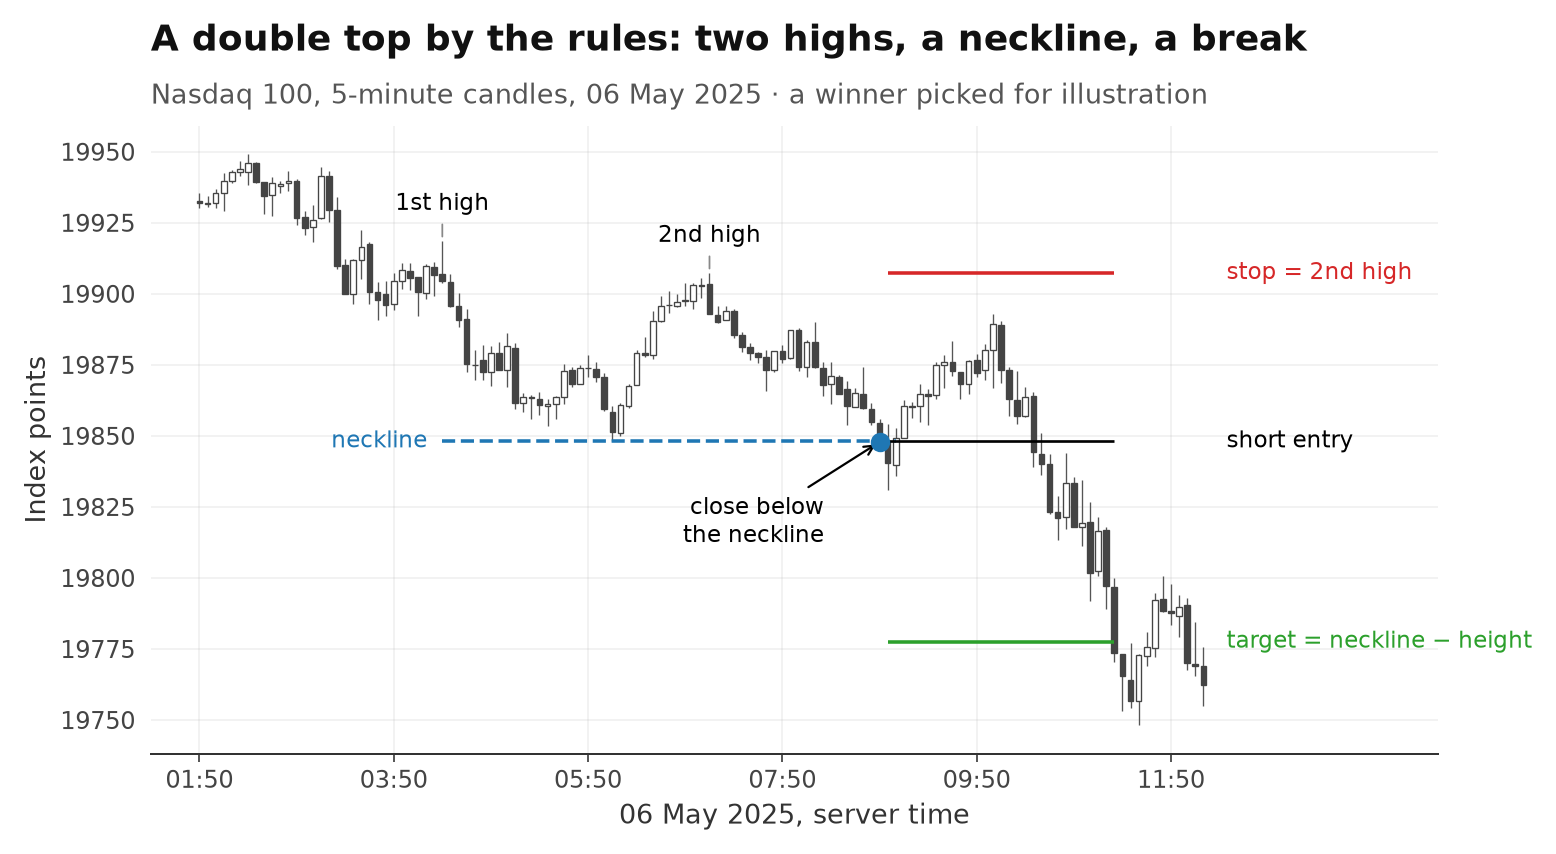
Price makes a high, pulls back, climbs to the same high again — and fails. When it then breaks the low in between, the top is called in.
The low between the two highs is the neckline. The textbook says: once a candle closes below it, sell. The expected move is the height of the pattern, measured from the neckline down.
It is one of the best-known reversal patterns, and on a chart it often looks perfect. The question is whether it works when you trade every one, not just the ones you remember.
02What we tested
A double top had to be found by a computer, not by eye. So every part of the pattern got a fixed number.
- A high is the highest candle of the 6 candles before and after it (half an hour each way)
- Two highs in a row, 1 to 10 hours apart, within 0.10 % of each other
- Neckline = the lowest low between them. The pattern must be at least 1.5 × the average candle range (ATR 14) tall
- Signal: the first close below the neckline within 5 hours — as long as price has not gone back above the second high
We ran this on three markets on the 5-minute chart, with three settings for how "equal" the two highs must be:
Markets: Nasdaq 100, gold (XAU/USD) and EUR/USD. Tolerances: 0.05 %, 0.10 % and 0.20 %. The 0.10 % version was set as the main test before any result was known; all other numbers were fixed in advance and not tuned. Results are shown with the three markets pooled.
03How a trade is counted
Short at the next open after the break. Stop at the second high, target one pattern height below the neckline.
| Entry | Short at the open of the candle after the close below the neckline |
|---|---|
| Stop | The second high. The distance to it is the risk unit 1R |
| Target | Neckline minus the height of the pattern |
| Time limit | Closed after one day (288 candles) if neither is hit. Stop and target in the same candle count as a stop |
| Positions | One trade at a time per market. Median holding time: 105 minutes |
Here is the catch. You only enter once price has closed below the neckline. That move is already gone: it brings you closer to the target and further from the stop. In the median trade, the target was 0.90R away. Only 26 % of trades had a target at least as far as the stop.
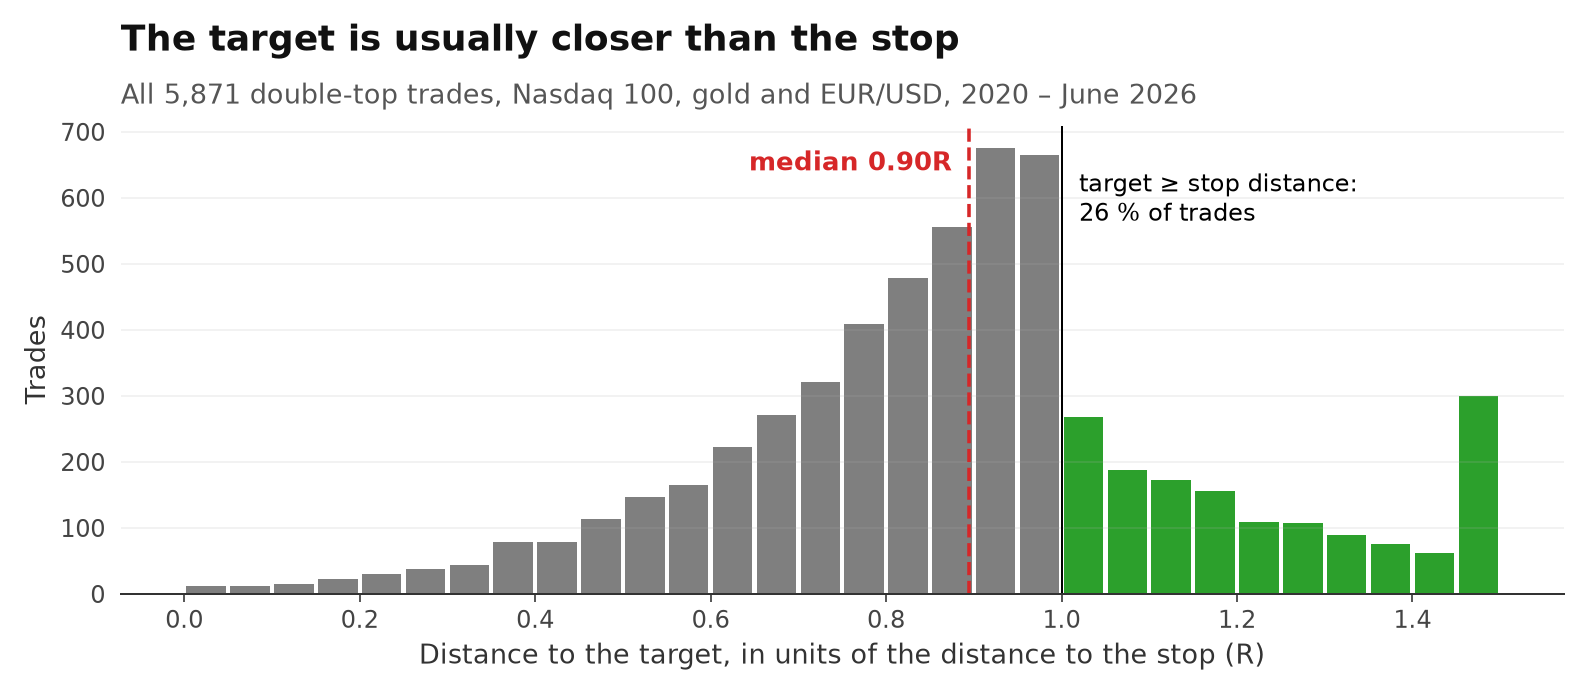
With a target at 0.90R, you need to win about 53 % of the time just to break even — before costs. The double top won 52.1 %.
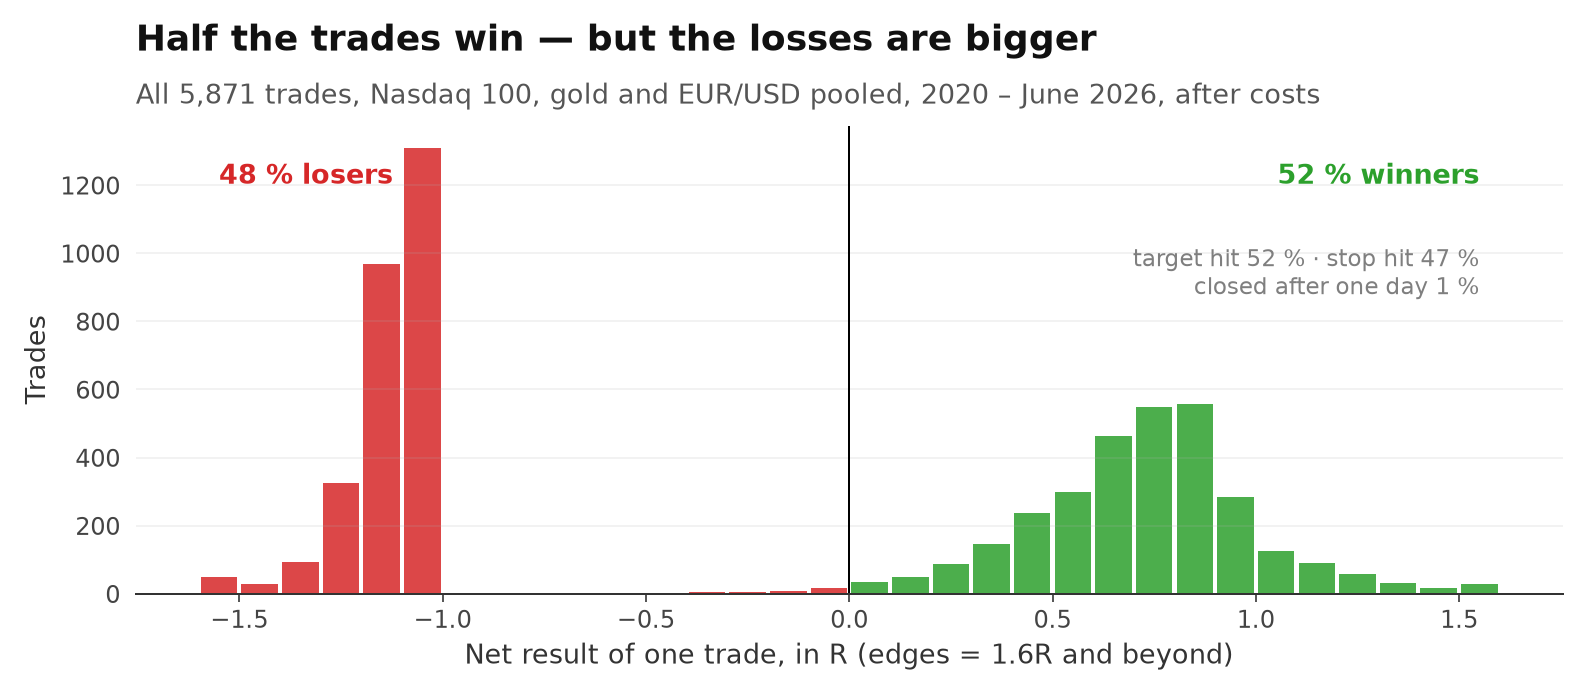
An average win was +0.73R, an average loss -1.12R — after costs. That is why a win rate above 50 % still loses.
04Costs
On a 5-minute chart the stop is close. So a few points of spread are a big slice of the risk.
Every trade pays the real spread at entry plus slippage: 0.5 index points on the Nasdaq, $0.50 on gold, half a pip on EUR/USD. Because the stops are tight — a median of 39 points on the Nasdaq and $4.83 on gold — that costs a median of 9.9 % of the risk on every trade.
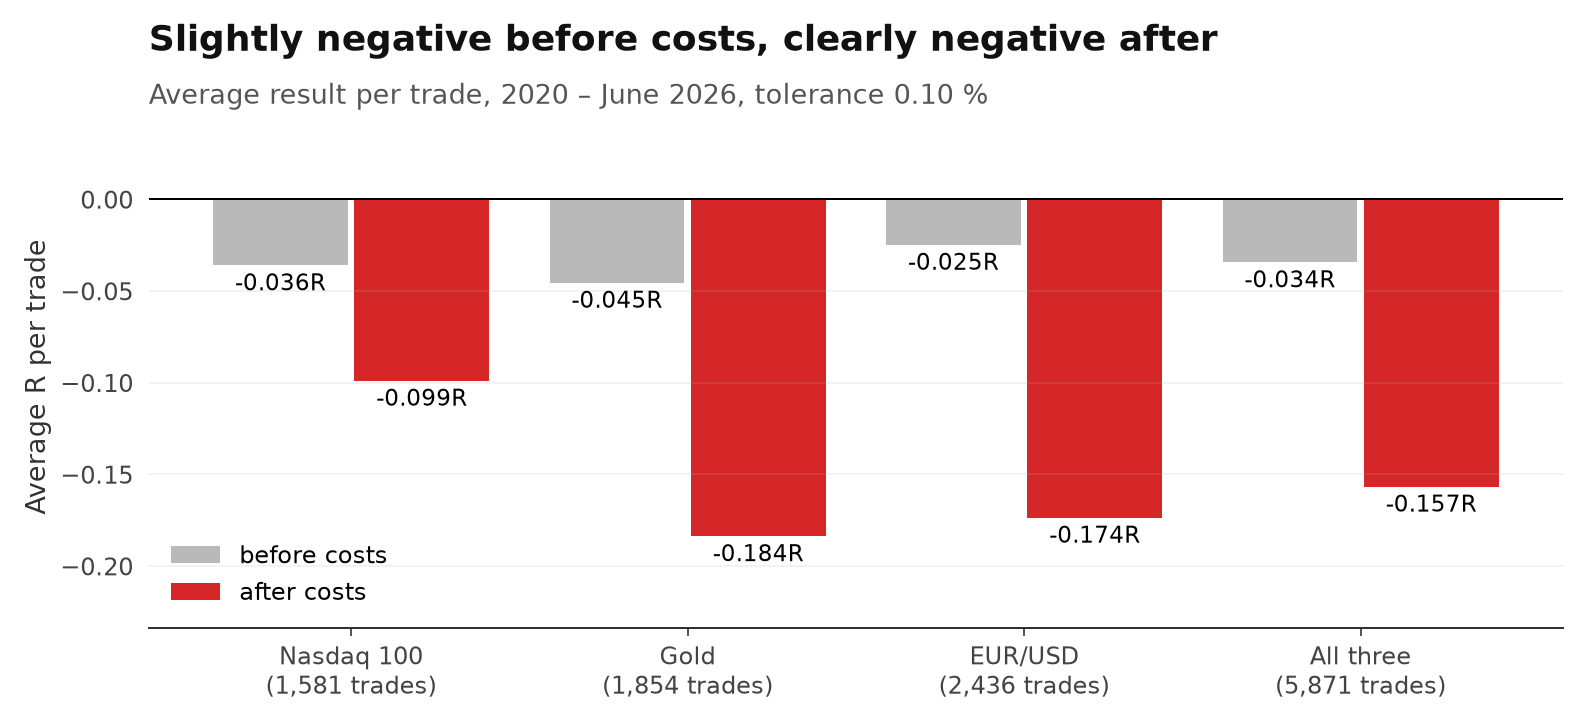
Before costs, the double top was already slightly negative: -0.034R per trade, -201R in total. After costs it ended at -920R. The pattern did not predict anything; the costs did the rest.
05Build first, judge later
2020–2023 is the period anyone could have looked at. Only 2024–2026 shows whether it lasts.
We split the data in two. 2020–2023 is the "looks good on the chart" period. 2024 – June 2026 is the test: data that played no part in choosing the rules.
Here there was nothing to carry over. Before 2024 the double top averaged -0.151R per trade after costs. After 2024 it averaged -0.166R on 2,286 new trades, and its win rate fell from 52.9 % to 50.7 %.
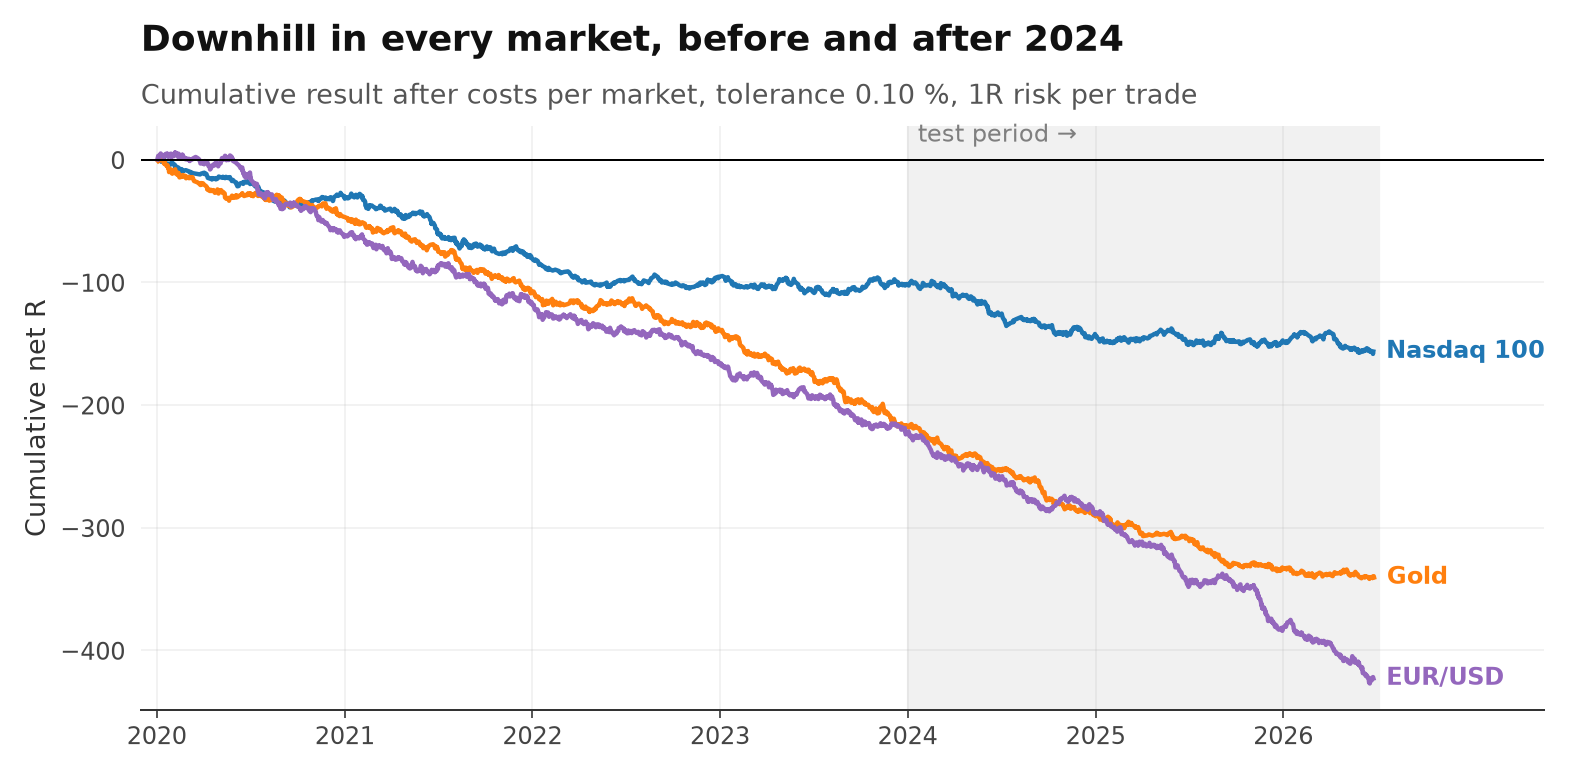
All 3 markets lost after 2024 — before costs as well as after.
06The random test
A pattern only counts if it beats random trades with the same direction, the same hour, the same stop and the same target.
A losing result alone does not prove the pattern is useless. Maybe any short with such a tight stop loses after costs.
That's why every real trade got a random twin: same market, short, same entry hour, the same stop and target distance in price and the same one-day limit — but on a random weekday of the same period. We built 1,000 such random versions of the whole system.
"Better than 95 % of random versions" means only 1 in 20 random versions did as well. 50 % means the pattern is indistinguishable from chance. Below 50 %, random trades did better.
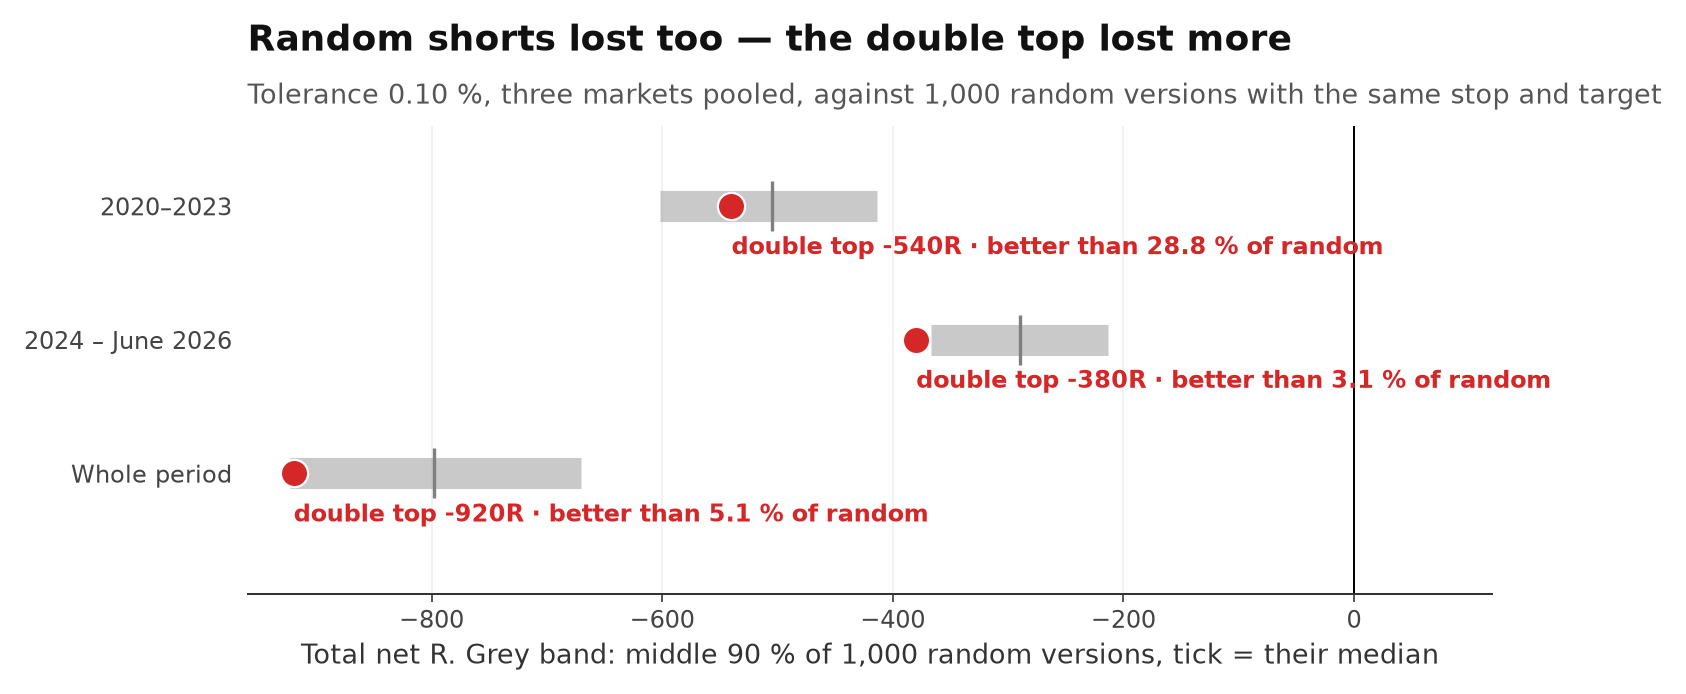
| Double top, 0.10 % | Trades | Per trade | Random median | Beats random |
|---|---|---|---|---|
| 2020–2023 | 3,585 | -0.151R | -0.141R | 28.8 % |
| 2024 – June 2026 | 2,286 | -0.166R | -0.127R | 3.1 % |
| Whole period | 5,871 | -0.157R | -0.136R | 5.1 % |
Yes, random shorts lost too: 0.0 % of the 1,000 random versions made money. They had the same tight stops and paid the same kind of costs. But the double top did worse: after 2024 only 3.1 % of the random versions lost more. If the pattern carried information, it pointed the wrong way.
07Markets and settings
No market and no setting made money. The one that looked best before 2024 was the worst after.
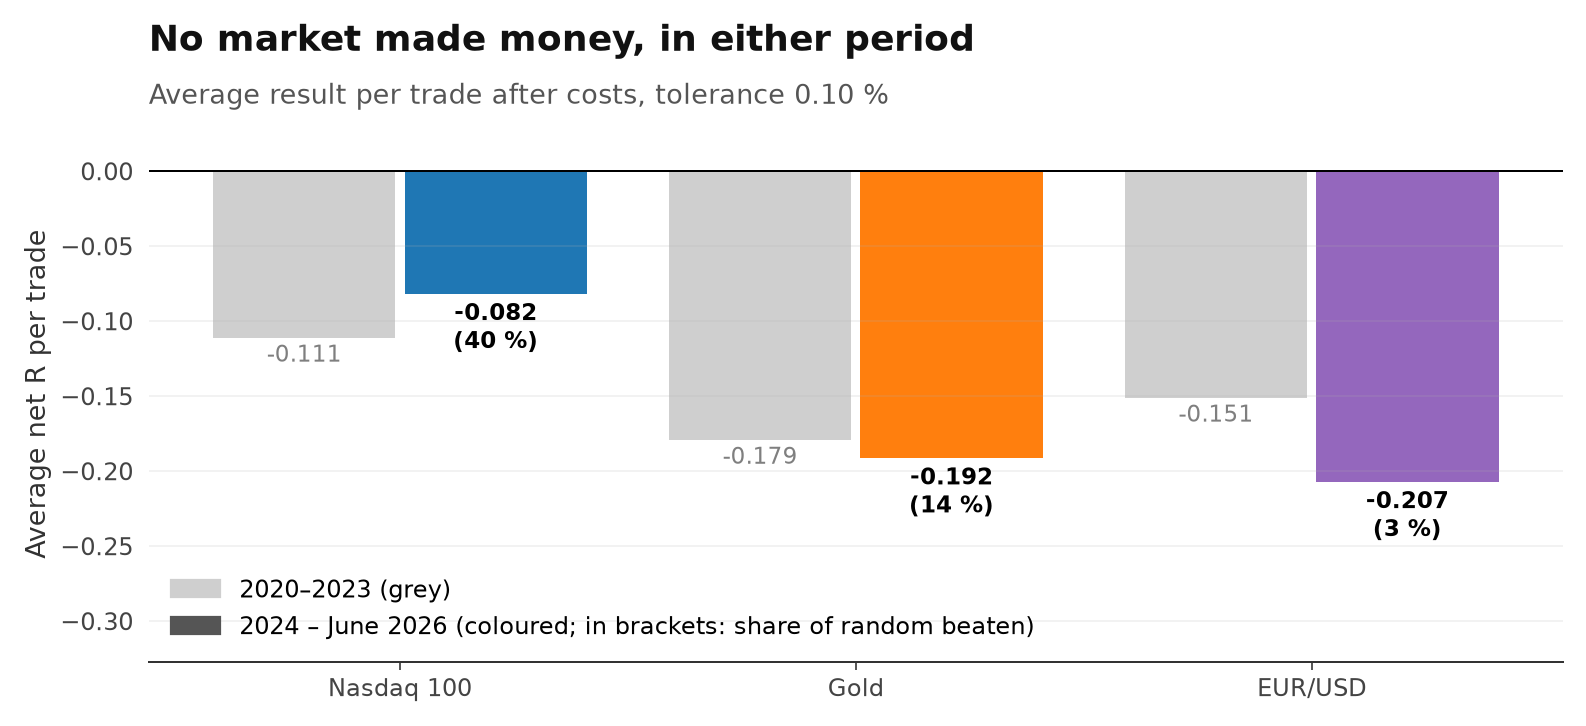
| Tolerance 0.10 % | Trades | 2020–2023 | 2024–2026 | Beats random after 2024 |
|---|---|---|---|---|
| Nasdaq 100 | 1,581 | -0.111R | -0.082R | 39.9 % |
| Gold | 1,854 | -0.179R | -0.192R | 13.6 % |
| EUR/USD | 2,436 | -0.151R | -0.207R | 2.8 % |
The Nasdaq lost the least and sat close to chance. EUR/USD lost the most and did worse than 97 % of its random versions after 2024.
How equal must the two highs be? We tried three tolerances. A stricter rule did not help:
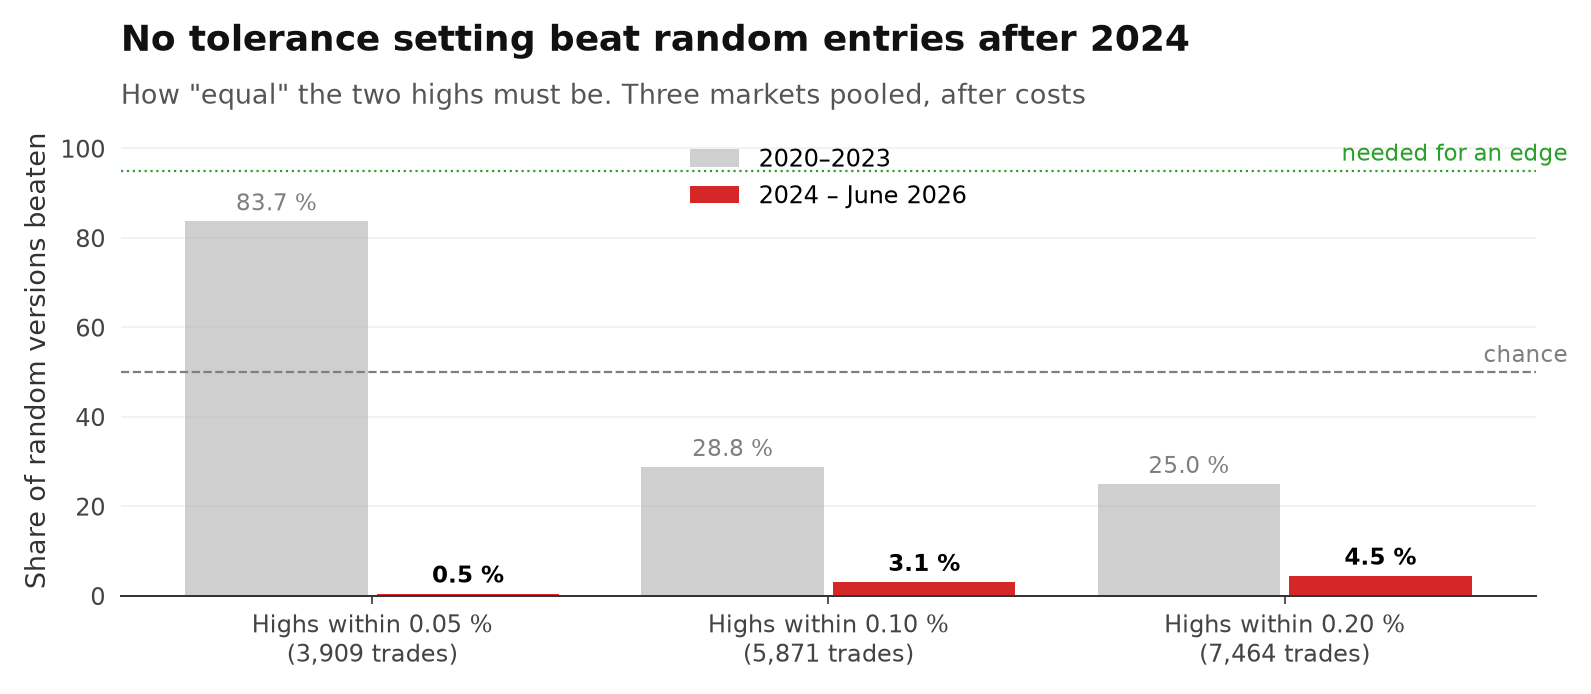
| Highs within | Trades | 2020–2023 | Beats random | 2024–2026 | Beats random |
|---|---|---|---|---|---|
| 0.05 % | 3,909 | -0.136R | 83.7 % | -0.202R | 0.5 % |
| 0.10 % | 5,871 | -0.151R | 28.8 % | -0.166R | 3.1 % |
| 0.20 % | 7,464 | -0.139R | 25.0 % | -0.145R | 4.5 % |
The strictest version (0.05 %) looked best before 2024 — still a loss, but better than 83.7 % of random. After 2024 it was the worst of all: better than only 0.5 %.
The 0.20 % version was compared with 200 random versions instead of 1,000.
08Verdict
Traded by exact rules, the double top averaged -0.157R per trade after costs on 5,871 trades and did worse than random shorts with the same stop and target — most clearly on data after 2024.
The double top is easy to see in hindsight. What we could not find is any sign that the break of the neckline predicts a fall better than a short at a random time.
If you trade double tops
- Check the payoff, not the win rate. With the textbook stop and target, a win pays less than a loss costs. 52 % winners was not enough.
- Mind the costs on fast charts. On 5-minute candles, spread and slippage took 9.9 % of the risk per trade.
- Don't trust the ones you remember. The clean examples stick in memory; the 5,871 mechanical ones lost.
09Limitations
- One mechanical definition. No prior uptrend was required, and no volume or higher-timeframe filter was used. A trader picking patterns by eye is not tested here.
- Only the 5-minute chart and only the short side. The double bottom (long) was not part of this test.
- Stop exactly at the second high, target exactly one pattern height. Other exits may behave differently — and tuning them adds its own risk of luck.
- EUR/USD costs use the same idea translated to FX prices (spread plus half a pip). The broker's spread was partly recorded as zero in early years.
- Pooled results count each trade as 1R, even when two markets had a trade open at the same time. Random twins may overlap; real trades do not.
- p-values are not corrected for testing three settings.
The 60-second version
This study started as a Reel. Share it with someone who still shorts every double top.
Next in the research library
- Do fair value gaps actually work? We tested almost 100,000 No usable edge
- Can one 5-minute candle predict the next six hours? Yes — the direction carries
- Does the Ichimoku cloud actually give you an edge? A faint edge, not proven
- Do Bollinger Bands actually predict reversals? in the lab
- Does Fibonacci actually work in trading? in the lab
- Does the weather in New York actually affect the Nasdaq? in the lab