Do fair value gaps actually work? We tested almost 100,000
Fair value gaps are everywhere in trading content. We found every single one on six and a half years of Nasdaq 5-minute charts — 98,840 of them — traded the retest, traded the inverted version, and asked the question that matters: does price actually go where the gap says it will?
01What a fair value gap is
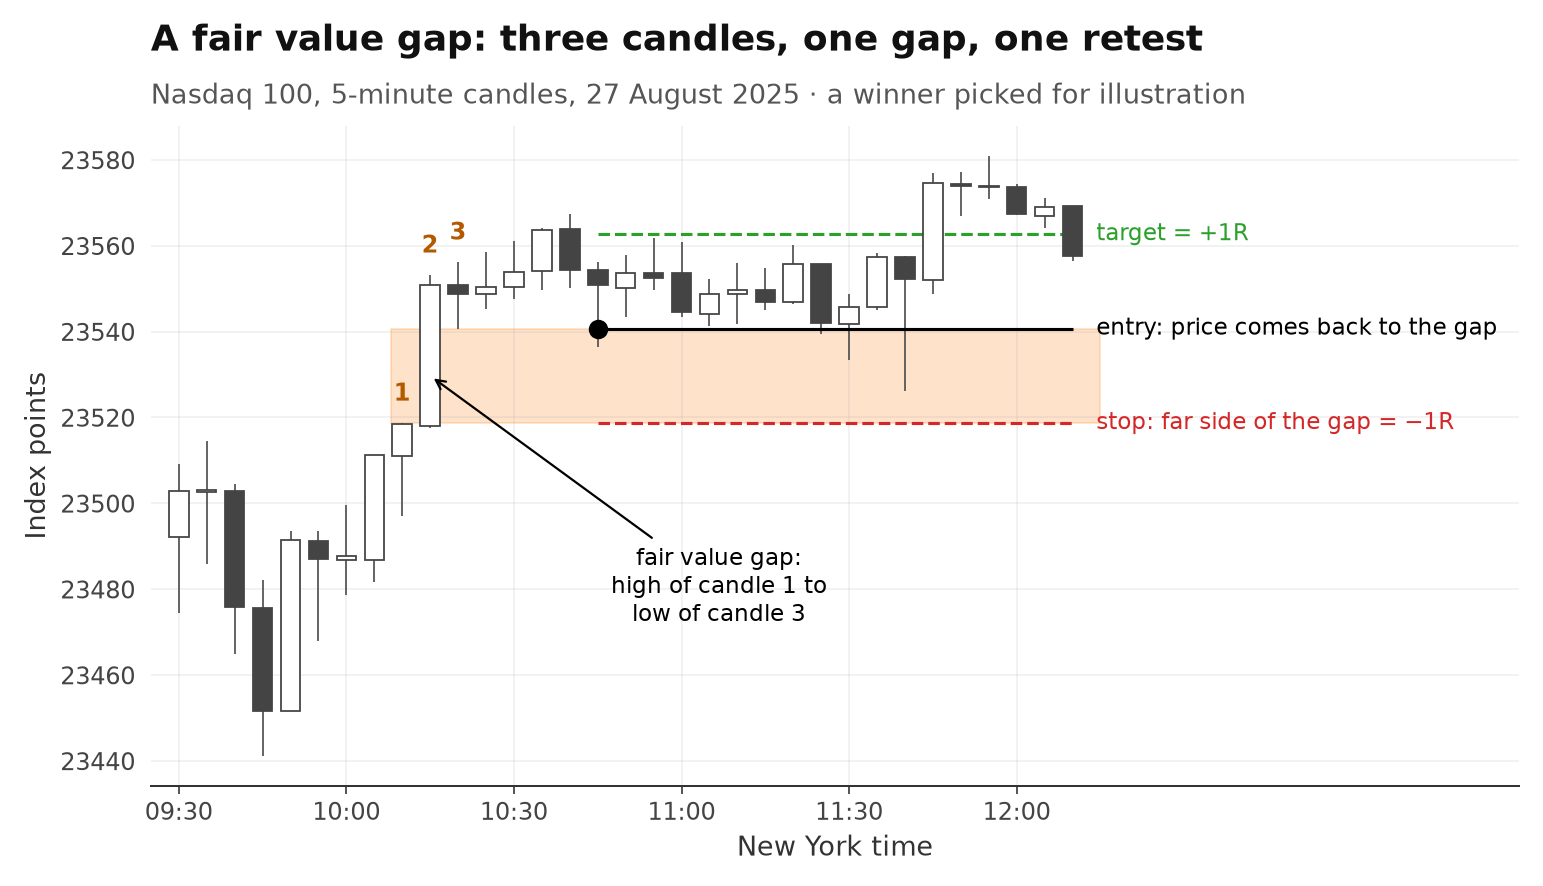
Three candles, and the third one does not overlap the first. The space in between is the gap.
A fair value gap (FVG) is one of the core ideas of ICT and "smart money" trading. When price moves fast, three candles in a row can leave a hole: in an up-move, the low of the third candle stays above the high of the first. The middle candle moved so quickly that price never traded in between.
The usual reading: that gap is an "imbalance". Price tends to come back to fill it — and when it does, the original move should continue. So you wait for the retest, buy at the edge of the gap and put the stop on the other side.
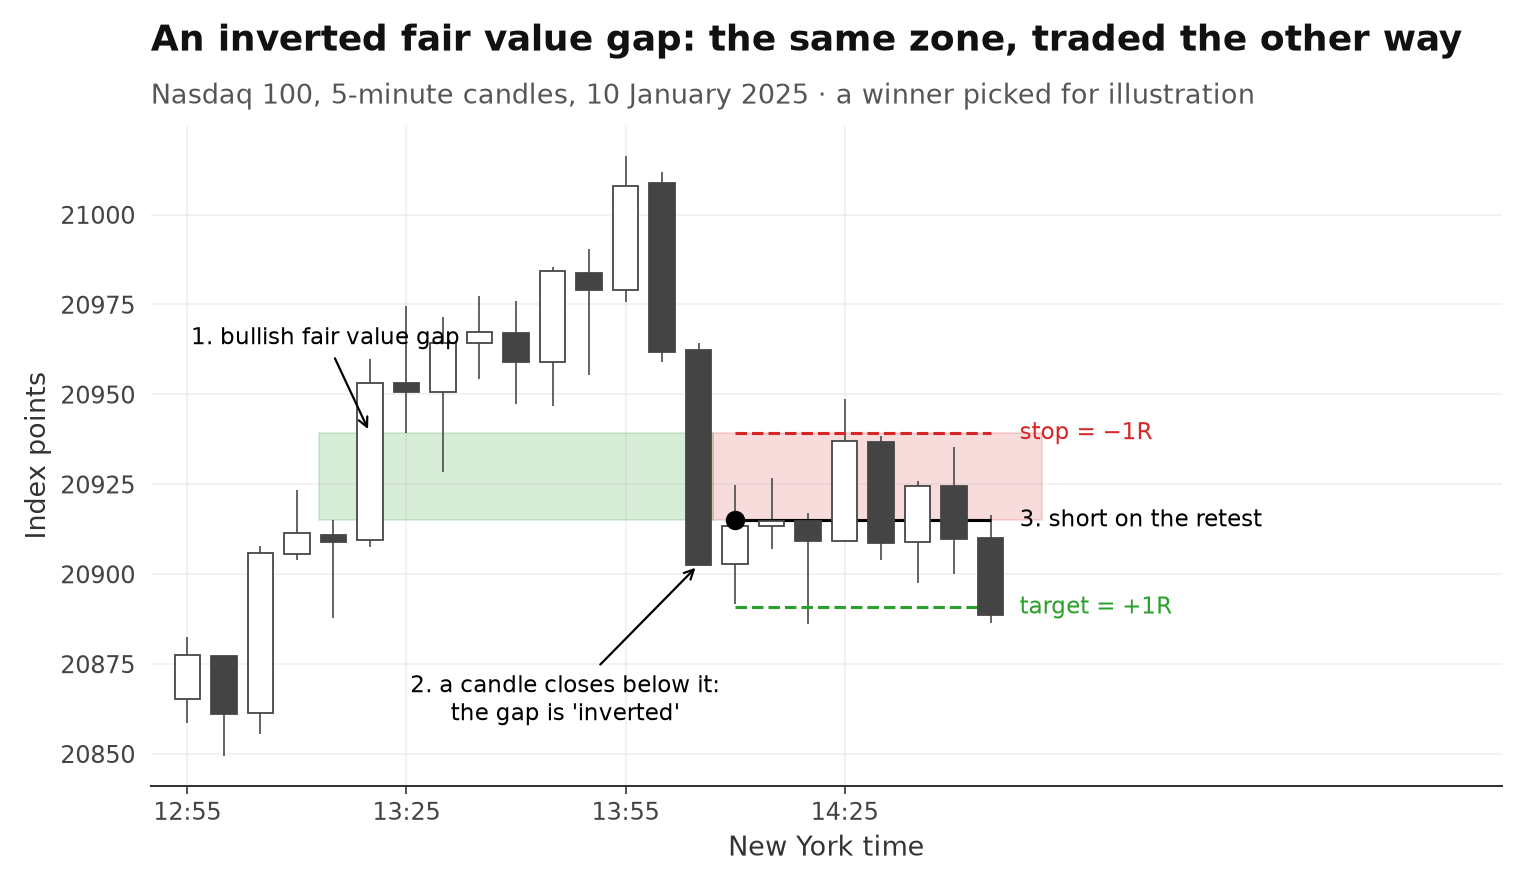
The inverted fair value gap (IFVG) turns this around. If a candle closes through the whole gap, the gap has "failed" — and the same zone is now traded in the opposite direction on the next retest.
02What we tested
Every gap counts — no hand-picking, no filtering by how good it looks in hindsight.
We scanned every 5-minute candle of the Nasdaq 100 from January 2020 to June 2026, around the clock. Every three-candle gap counts:
- Bullish FVG: low of candle 3 above the high of candle 1. Bearish FVG: high of candle 3 below the low of candle 1.
- Entry: a limit order at the near edge of the gap, filled the first time price comes back (within 500 candles).
- Stop: the far edge of the gap. So 1R = the size of the gap.
- Target: 1R as the main test, plus 2R and 3R. Anything still open after 8 hours is closed.
- IFVG: the same gaps, but only once a candle has closed through the far edge; then the retest is traded the other way, 1R target.
98,840 gaps in total, 95,669 FVG trades and 88,986 IFVG trades. That is about 59 gaps per trading day: 52,401 bullish and 46,439 bearish. 96.8 % of them were retested, most of them almost immediately — 45 % on the very next candle. 90 % of all gaps were broken and retested from the other side, which makes them IFVG trades. The two liquidity-sweep filters are explained in section 09.
03How a trade is counted
We measure in R. A 1R target and a 1R stop means you need to win half your trades just to break even.
| Entry | Limit order at the near edge of the gap, placed after the third candle has closed — no look-ahead |
|---|---|
| Risk unit | 1R = size of the gap (median 3.5 index points) |
| Exit | Stop (−1R), target (+1R, +2R or +3R), or the close after 96 candles (8 hours) |
| Same candle | If stop and target are both inside one later candle, we count the stop. In the candle where the order fills, a touch of the target counts as a win (section 06 shows why that matters) |
| Costs | Real spread at entry plus 0.5 index points slippage; median 2.1 points per trade |
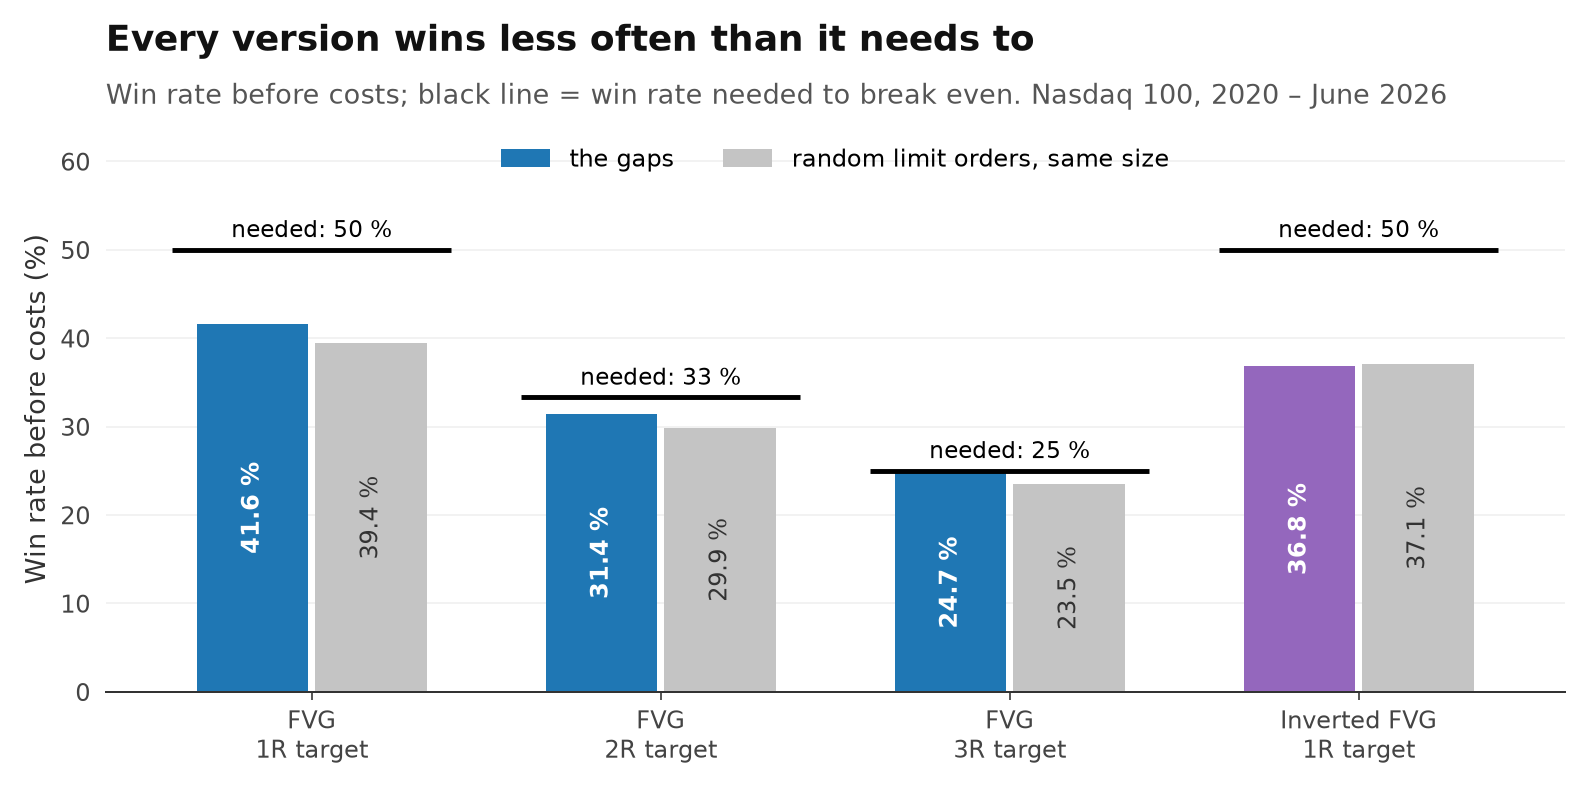
Break-even before costs is a 50 % win rate at 1R, 33 % at 2R and 25 % at 3R.
04The win rates
Below break-even, every time — before a single cent of cost.
| Before costs, 2020 – June 2026 | Trades | Win rate | Needed | Profit factor | Per trade |
|---|---|---|---|---|---|
| FVG, 1R target | 95,669 | 41.6 % | 50 % | 0.71 | −0.169R |
| FVG, 2R target | 95,669 | 31.4 % | 33 % | 0.91 | −0.059R |
| FVG, 3R target | 95,669 | 24.7 % | 25 % | 0.97 | −0.020R |
| IFVG, 1R target | 88,986 | 36.8 % | 50 % | 0.58 | −0.264R |
The plain retest with a 1:1 stop and target won 41.6 % of its trades, a profit factor of 0.71. The inverted version did worse: 36.8 % and 0.58. Those are the figures from our Reel, and this test reproduces them exactly.
A wider target lowers the win rate about as much as it raises the payout. At 3R the loss before costs shrinks to −0.020R per trade — close to zero, but still below it.
05The real question: direction
Forget stops and targets for a moment. After the retest, does price go the way the gap says?
Win rates depend on where you put the stop and the target. So we asked the simplest possible question: after the retest entry, is price on the expected side 5 minutes, 15 minutes, 1 hour and 2 hours later? If gaps carry information, this should be clearly above 50 %.
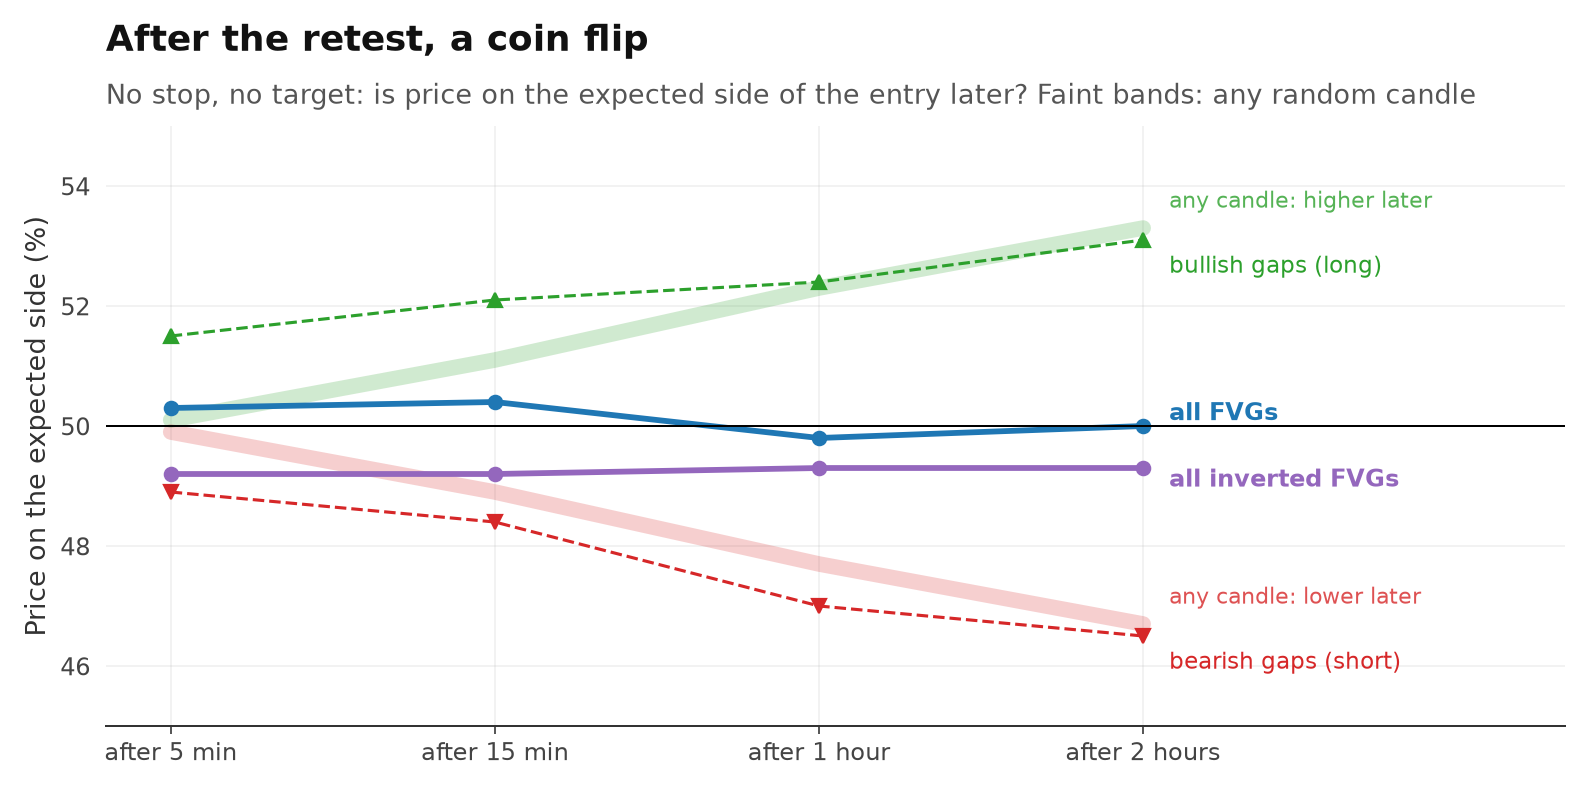
One hour after the entry, price was on the right side 49.8 % of the time for fair value gaps and 49.3 % for inverted ones. That is a coin flip. On the data after 2024 the numbers were 49.9 % and 49.6 %.
Bullish gaps look a bit better — 52.4 % after an hour. But any random candle on the Nasdaq was followed by a higher price 52.3 % of the time: the index went up over those years. Bearish gaps sit just as close to the market's "down" rate (47.0 % against 47.7 %). The gaps add nothing to the trend that was already there.
Random limit orders of the same size (section 08) were on the right side 50.2 % of the time after an hour — fair value gaps did not beat them on direction.
06Inside one candle
The typical gap is about a third of one 5-minute candle. A 5-minute backtest cannot see what happens inside it.
If gaps are a coin flip, why is the win rate at 1:1 not 50 %, but 41.6 %? The answer is in the size of the gaps. The median gap is 3.5 index points; the median 5-minute candle on the Nasdaq spans 11.0 points. Stop and target sit so close together that in 45 % of the trades both were touched inside the same candle. And in 51 % of trades the stop was hit in the very candle that filled the order — price came back to the gap and simply ran through it.
Inside one candle, a 5-minute chart does not tell you what came first. So the result depends on a counting rule:
- Like most backtests (and our main test): if the fill candle touches the target, it is a win — even though price may have reached that level before the order was filled.
- Strictly: in the fill candle the target only counts if the candle closes beyond it. A touch of the stop always counts, because price was moving through the entry toward the stop.
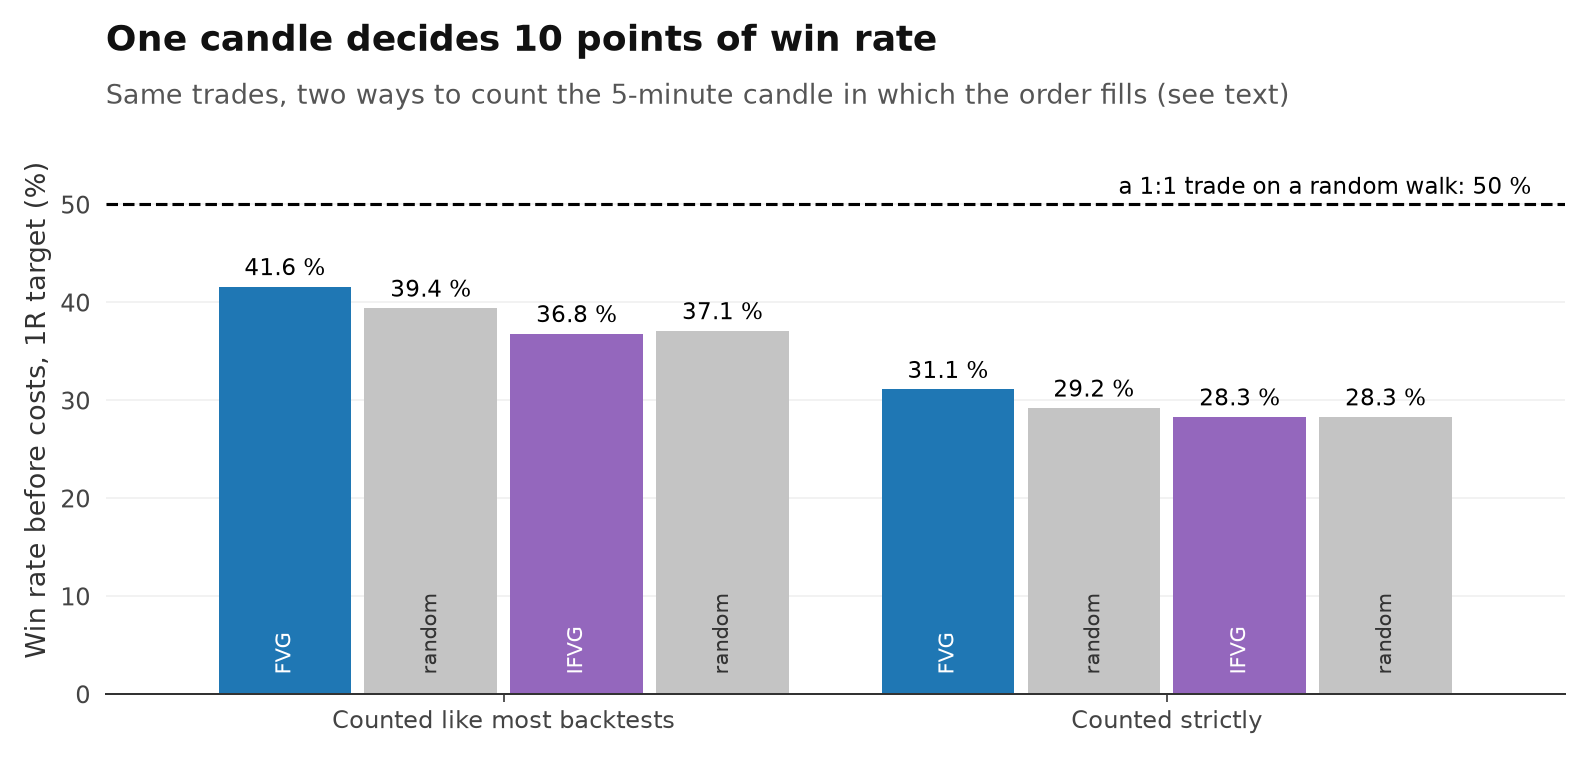
Counted strictly, the fair value gap retest wins 31.1 % instead of 41.6 %; the inverted gap 28.3 % instead of 36.8 %. One counting rule moves the result by 10 points. That is the honest caveat behind every FVG backtest on 5-minute data, including this one: the exact win rate is not knowable without tick data.
What does survive both rules is the comparison. Random limit orders of the same size, counted the same way, land almost exactly where the gaps land — about 2 points lower for regular gaps, level for inverted ones.
07Costs
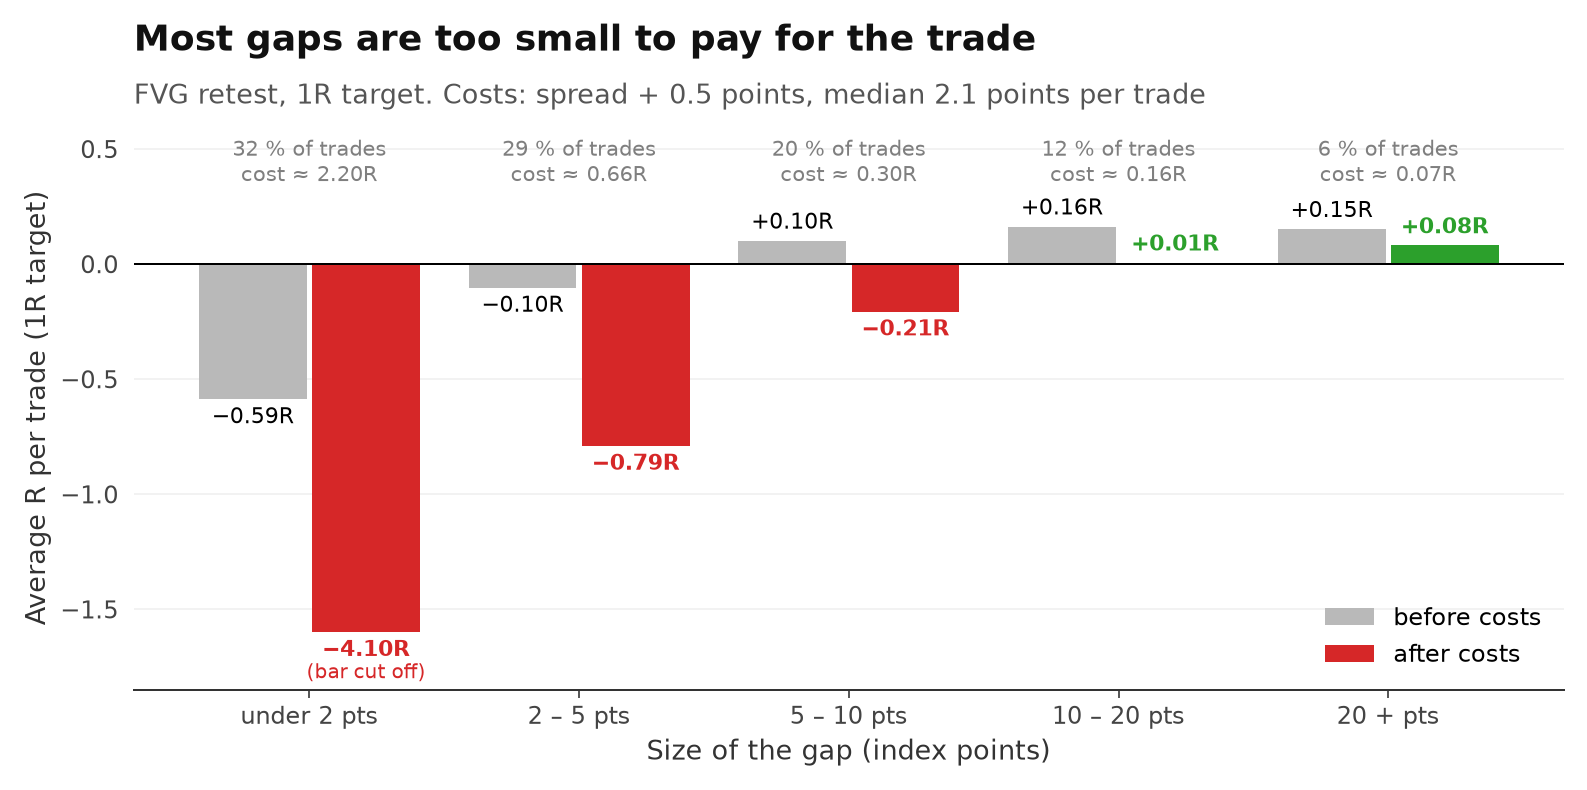
The median gap is 3.5 points wide; the median trade pays 2.1 points in spread and slippage. That is not a strategy problem, it is arithmetic.
Each trade paid the real spread plus 0.5 points slippage, 2.1 points in the median. Against a median gap of 3.5 points that is 0.57R per trade. 32 % of all gaps are smaller than 2 points, and on 33 % of the trades the costs were larger than the entire risk.
| 1R target | Win rate | Profit factor | Per trade (average) | Per trade (median) |
|---|---|---|---|---|
| FVG before costs | 41.6 % | 0.71 | −0.169R | — |
| FVG after costs | 34.0 % | 0.12 | −1.58R | −1.25R |
| IFVG after costs, 2024 – June 2026 | 31.0 % | 0.12 | −1.54R | −1.29R |
A profit factor of 0.12 looks absurd — it means the IFVG lost about 8 times what it won. It is real arithmetic, not a bug. Before costs the IFVG had a profit factor of 0.57 on the same trades. The average loss of 1.54R per trade is pulled down by the tiniest gaps: a gap of a few tenths of a point pays many times its own size in spread. Leave out every gap under 2 points and the IFVG still loses 0.50R per trade.
Large gaps are the exception that is worth a closer look. From 10 points up, the 1R test shows a small gain before costs (+0.16R and +0.15R) that even survives the costs. But random limit orders of the same size show the same kind of gain (+0.12R and +0.10R) — a sign that the counting rule from section 06 is doing the work. Counted strictly, every size class loses before costs; the best one, gaps of 20 points and more, makes −0.05R per trade.
081,000 random traders
A random trader places the same order as the gap trader — just at a random moment, in a random direction.
A backtest on its own proves little; the question is whether the gaps choose better moments than chance. So for every gap trade we built a random twin:
- a limit order the same distance from price, with the same stop and target size (scaled to the volatility at the time)
- in the same hour of the day, and in the same period (before or after 2024)
- with the same exit rules, the same counting rule and the same costs
- but on a random candle and in a random direction
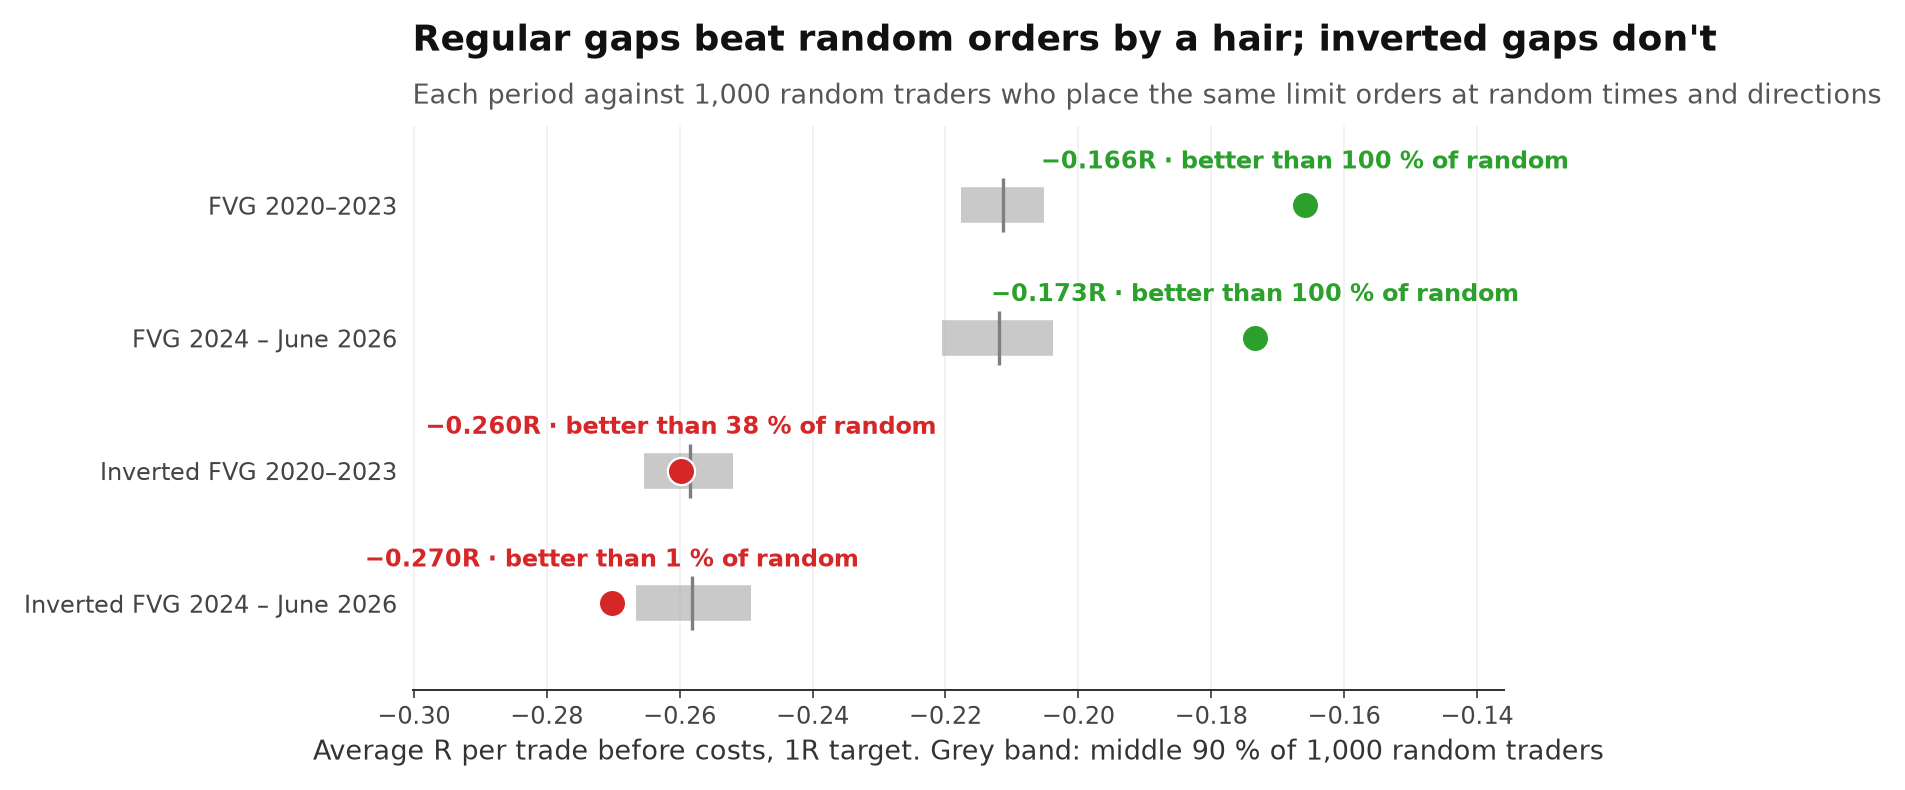
1,000 random traders each took exactly as many of these orders as the real test had trades.
| 1R target, before costs | Win rate | Random median | Per trade | Random median | Beats random |
|---|---|---|---|---|---|
| FVG 2020–2023 | 41.7 % | 39.4 % | −0.166R | −0.211R | 100 % |
| FVG 2024 – June 2026 | 41.3 % | 39.4 % | −0.173R | −0.212R | 100 % |
| IFVG 2020–2023 | 37.0 % | 37.1 % | −0.260R | −0.258R | 38 % |
| IFVG 2024 – June 2026 | 36.5 % | 37.1 % | −0.270R | −0.258R | 1 % |
Here the regular fair value gap earns some credit. Its retest entries did better than every one of the 1,000 random traders, before and after 2024, with every target. The difference is consistent, and it is small: +0.043R per trade, or about 2 points of win rate. It held under the strict counting rule, too (31.1 % against 29.2 %).
So gaps are not pure noise — the moment after a fast three-candle move is a slightly better place for a limit order than a random one. But that edge is worth about +0.04R before costs, while the median trade costs 0.57R. And it is not an edge in direction: one hour later, the gaps were no better than the random orders (section 05).
The inverted fair value gap does not even get that far. Before 2024 it sat in the middle of the random traders (38 %); after 2024 only 1 % of them did worse.
09Does a liquidity sweep help?
The usual ICT answer to a failing setup: only take it after liquidity has been swept. We tested two versions.
ICT traders rarely trade a gap on its own. The classic filter is a liquidity sweep first — price runs the stops above an old high or below an old low, and only then does the gap count. We kept only the inverted gaps whose breaking candle came within 4 hours (48 candles) after such a sweep, in the direction of the reversal:
- H4 swing sweep: a wick through the most recent confirmed swing high or low on the 4-hour chart, closing back inside
- Previous-day sweep: the same with yesterday's high or low
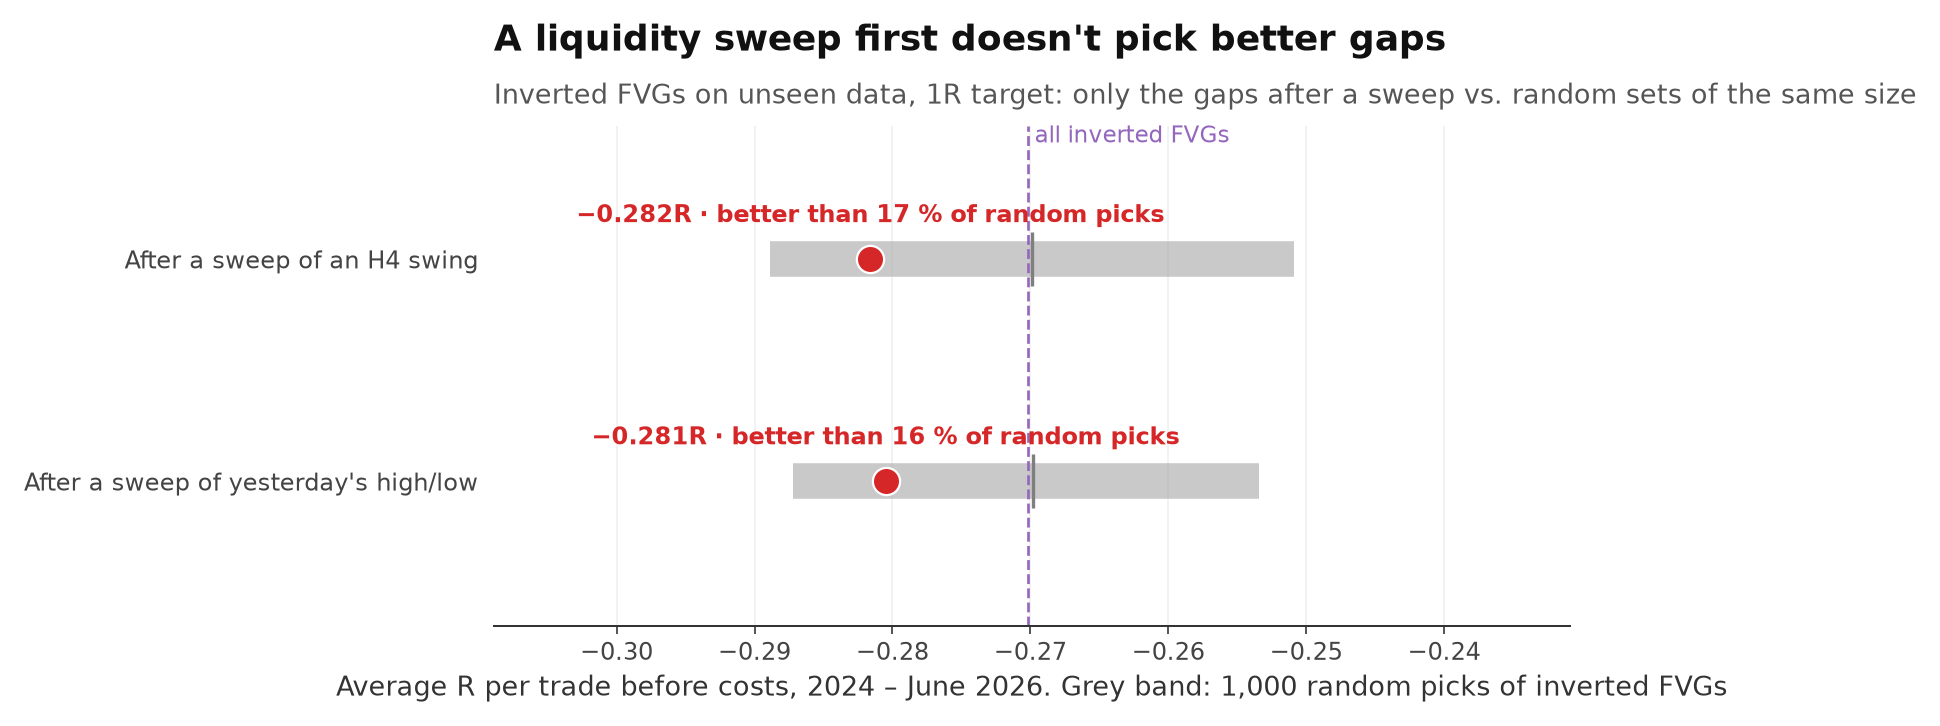
Both filters were fixed before the test. To see whether they choose better gaps, we compared each filtered set with 1,000 random sets of inverted gaps of the same size.
| IFVG, 2024 – June 2026 | Trades | Win rate | Per trade before costs | After costs | Beats random picks |
|---|---|---|---|---|---|
| All inverted gaps | 34,535 | 36.5 % | −0.270R | −1.54R | — |
| After an H4 swing sweep | 5,636 | 35.9 % | −0.282R | −1.34R | 17 % |
| After a previous-day sweep | 7,413 | 36.0 % | −0.281R | −1.35R | 16 % |
After costs the sweep versions lose less — but only because the gaps after a sweep are a little larger (median 4.2 and 4.0 points instead of 3.3), so the same costs weigh less. Before costs they are slightly worse than random sets of inverted gaps. The sweep does not pick better gaps.
If you want to see a full ICT setup — a sweep of the overnight range followed by a fair value gap in the New York morning — tested against random traders, read Does a simple ICT strategy beat 1,000 random traders?
10Verdict
On 98,840 fair value gaps, price went the expected way 49.8 % of the time. Retest entries were a hair better than random limit orders, but lost before costs at every target, and costs ate 0.57R per trade. Inverted gaps and sweep filters did not beat random at all.
Fair value gaps are easy to see and easy to believe in, because the chart is full of them and many look perfect afterwards — like Figures 1 and 2. But there are about 59 of them every day on the Nasdaq 5-minute chart, and as a group they do not tell you where price goes next.
If you trade fair value gaps
- Check the size of the gap against your costs. On the Nasdaq 5-minute chart, 32 % of all gaps are smaller than 2 points — about what spread and slippage cost.
- Be careful with 5-minute backtests of tight setups. When stop and target fit inside one candle, the counting rule decides the result.
- Compare against random, not against zero. The question is not "does it ever work" but "does it work better than the same order placed at random".
11Limitations
- One market (Nasdaq 100 CFD) and one timeframe (5 minutes), January 2020 to June 2026. Gaps on higher timeframes, or only in the New York session, were not tested separately.
- We traded every gap. Many FVG traders add context — a higher-timeframe bias, a minimum gap size, a session window. The sweep filters and the split by gap size are two such checks; others may behave differently.
- Stop and target often sit inside the same 5-minute candle; the exact win rate depends on how that candle is counted (section 06). The comparison with random orders uses the same rule on both sides.
- Fills are assumed at the limit price without slippage on entry; the 0.5-point slippage is charged as a cost. The broker's spread was partly recorded as zero in early years.
- Trades overlap — every gap is its own trade — so the sums are not one tradable account.
- 6 tests; p-values are not corrected for that. The split by gap size was made after the test.
The 60-second version
This study started as a Reel. Share it with someone who marks every gap on their chart.
Next in the research library
- Can one 5-minute candle predict the next six hours? Yes — the direction carries
- Does the double top pattern actually work? Worse than random
- Does the Ichimoku cloud actually give you an edge? A faint edge, not proven
- Do Bollinger Bands actually predict reversals? in the lab
- Does Fibonacci actually work in trading? in the lab
- Does the weather in New York actually affect the Nasdaq? in the lab