Does VWAP actually work?
We turned VWAP into 96 exact trading rules, tested them on 98,315 trades on the Nasdaq and the S&P 500, and compared every rule against random entries.
01What VWAP is
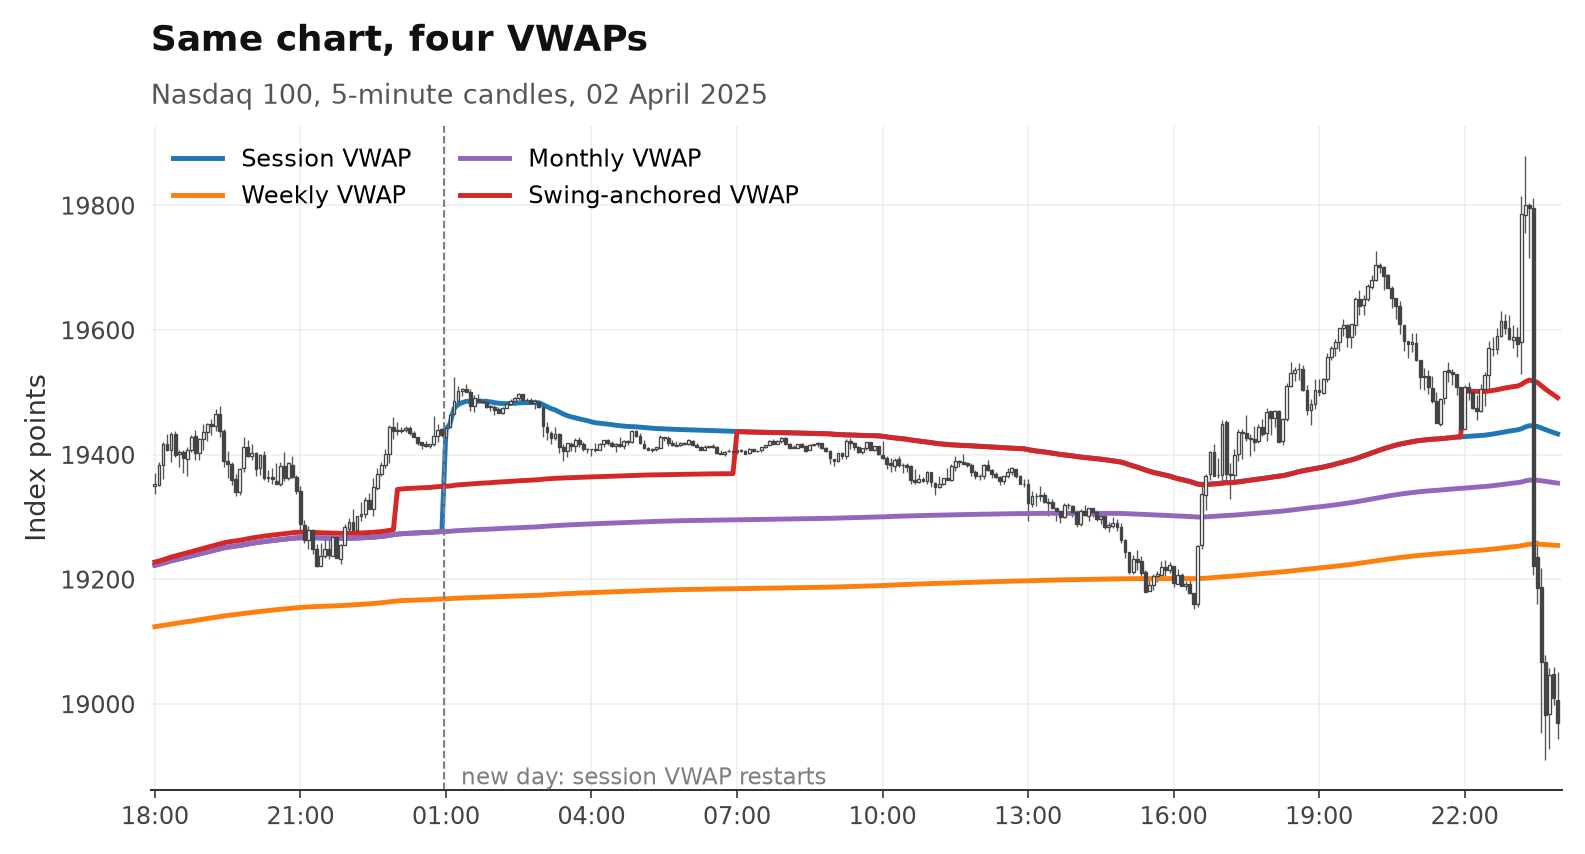
VWAP is the average price since a starting point, weighted by volume. The starting point changes everything.
Traders see VWAP as the "fair" price of a period. The theory: price reacts when it gets there.
But "the" VWAP doesn't exist. It depends on when you start counting:
- Session VWAP — restarts every day
- Weekly / monthly VWAP — restarts every week or month
- Swing-anchored VWAP — starts at the last major high or low
02What we tested
Three common ways to trade VWAP, written as exact rules — for all four anchors, long and short.
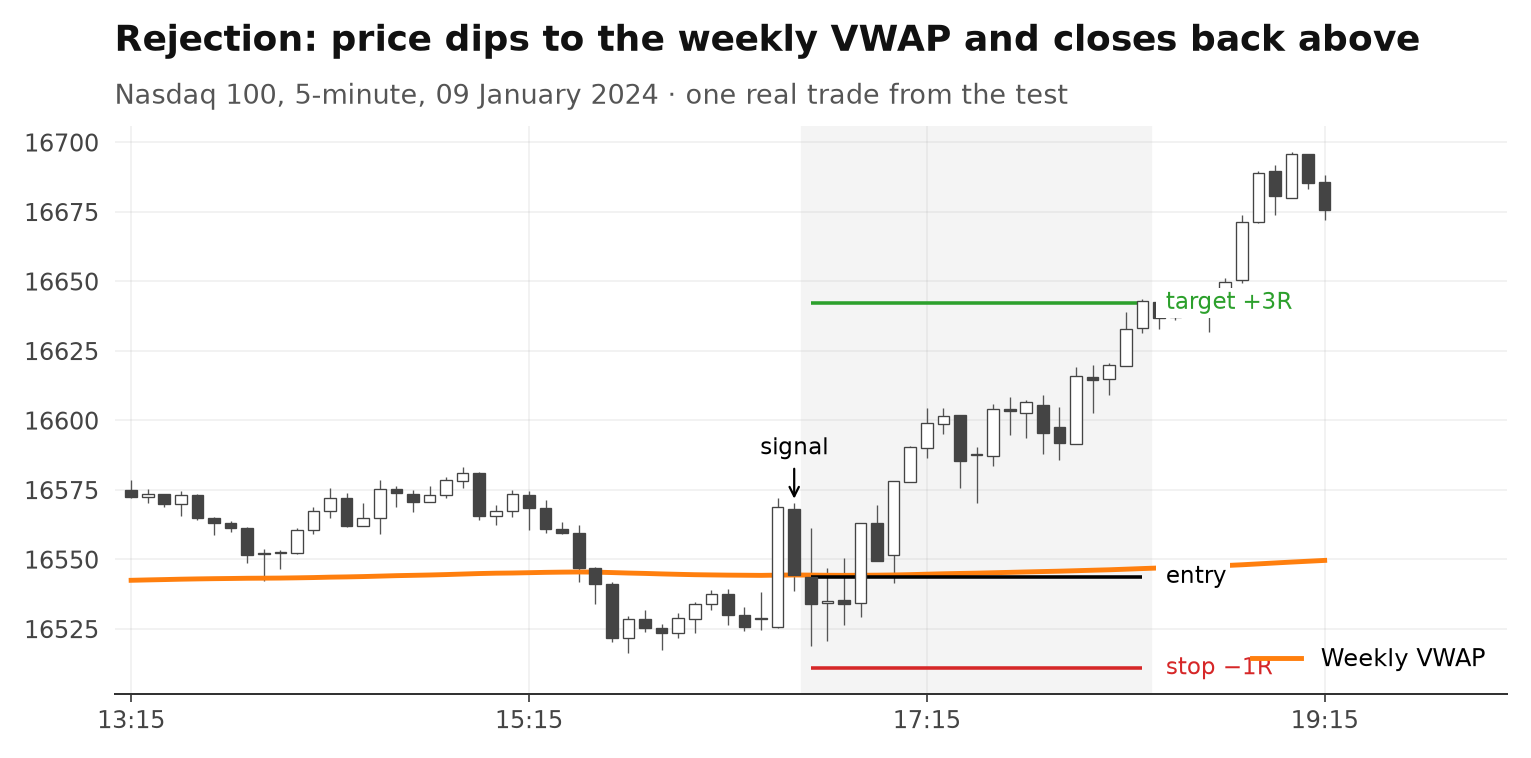
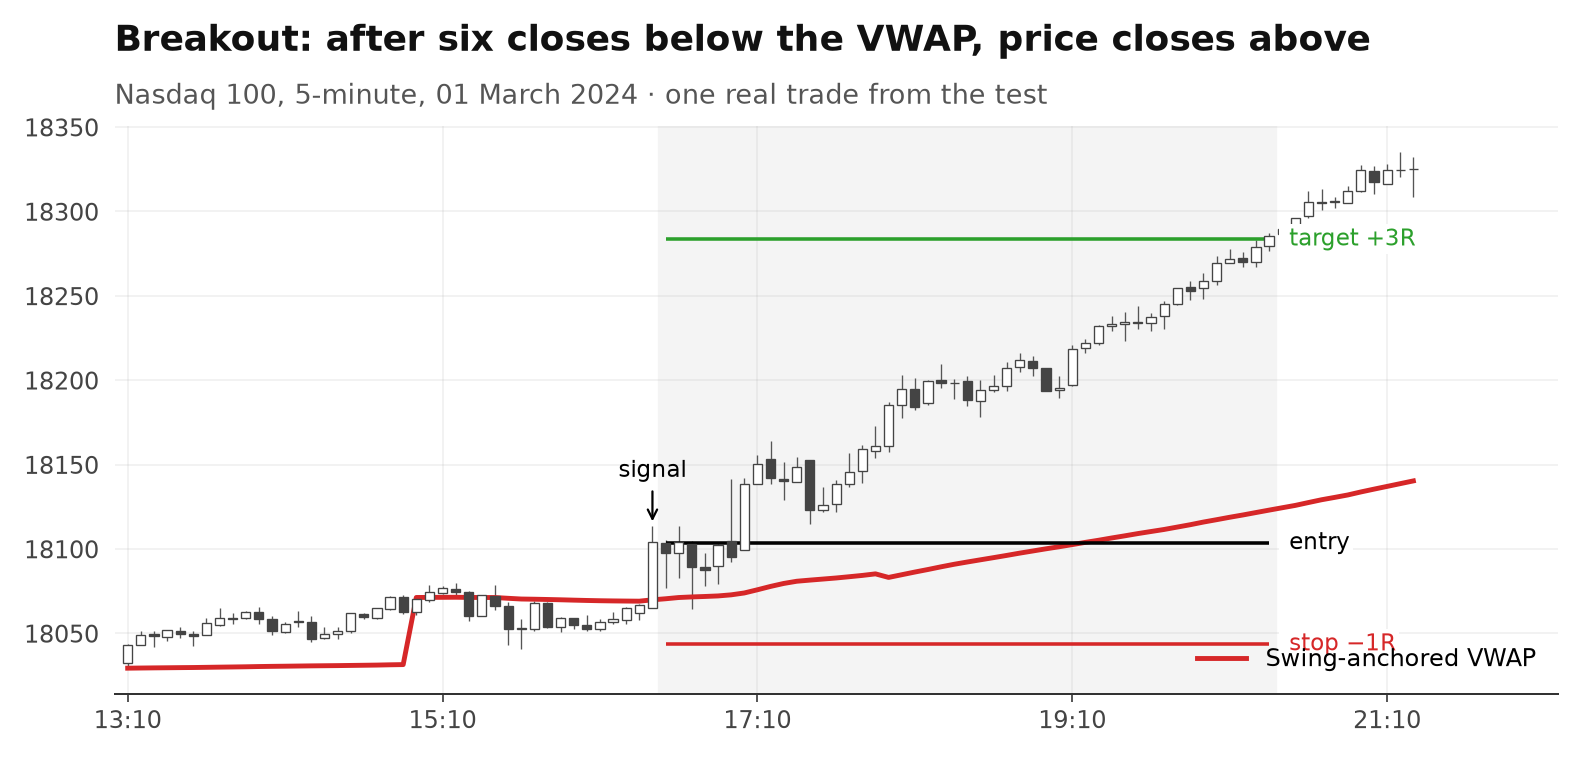
Each rule is shown below on one real trade from the test.
Rejection
Price dips to VWAP, touches it, and closes back on the same side. Buy the bounce.
Breakout
After six closes below VWAP, price closes above it. Buy the break.
Mean reversion
Price stretches more than 2 ATR away from VWAP. Bet on the snap-back.
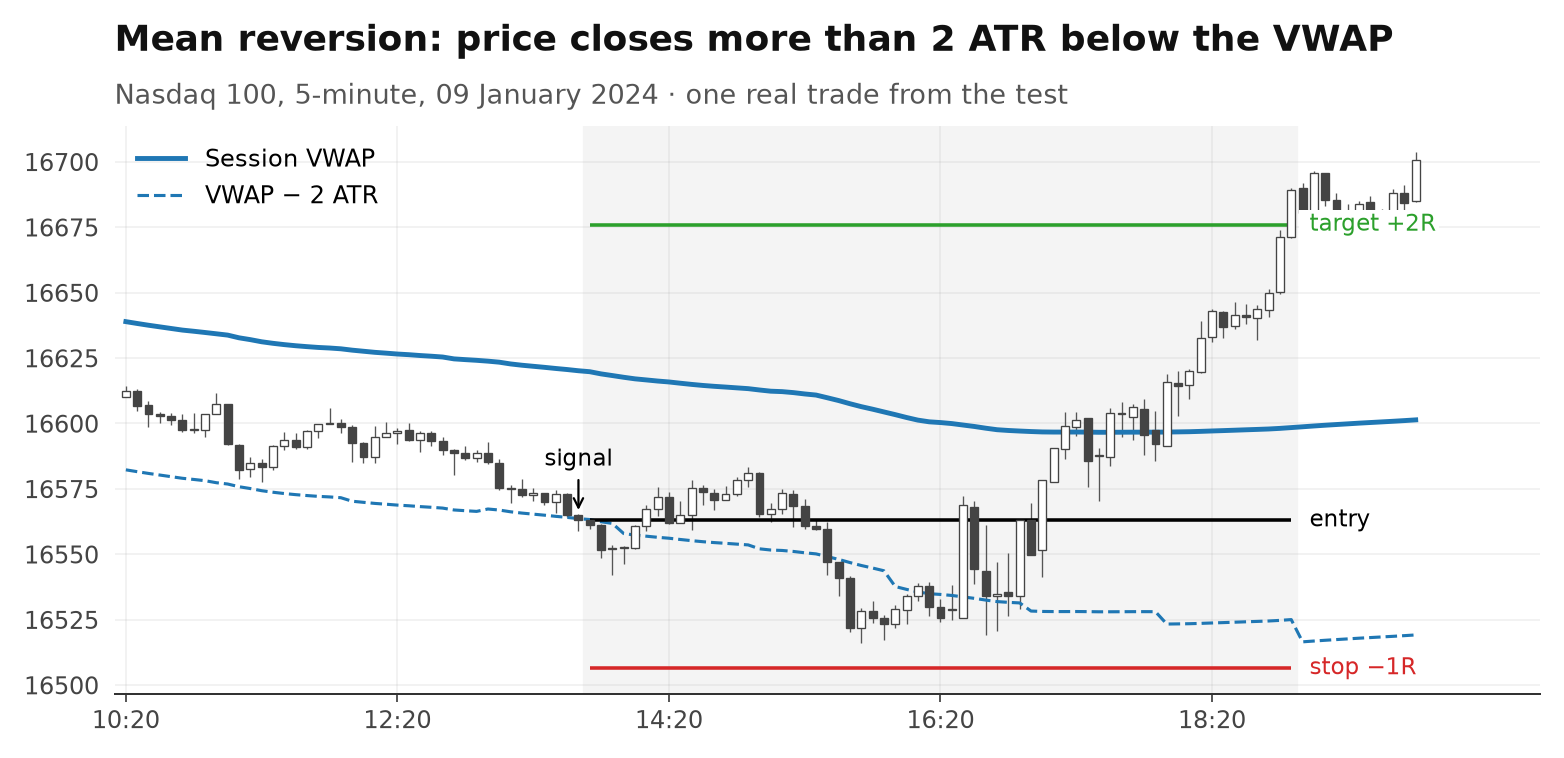
These three are winners, picked so the mechanics are easy to see. Most trades in this test lost: win rates were between 34 and 39 %.
We tested every combination separately:
Markets: Nasdaq 100 and S&P 500. Timeframes: 5 and 15 minutes. Swing anchor: a 1-hour high or low with five lower highs (or higher lows) on each side, used only after those five hours have closed.
03How a trade is counted
Every rule follows the same mechanics. No discretion, no hindsight.
| Entry | Signal on a closed candle, entry at the open of the next candle |
|---|---|
| Stop | 0.5, 1, 1.5 or 2 × ATR (1-hour, 14 periods). This distance is 1R — our unit of risk |
| Target | 1R, 2R or 3R |
| Time exit | After about one trading day (276 five-minute candles) |
| Worst case | If stop and target are hit in the same candle, we count the stop. Gaps fill at the open |
| Positions | One at a time per rule |
We measure in R, not dollars. +0.1R per trade means: on average you win a tenth of what you risk.
04Costs
Before costs the rules made money. After costs they lost it.
Every trade pays the real spread at entry plus 0.5 points slippage. On the Nasdaq that is about 2.1 points per trade.
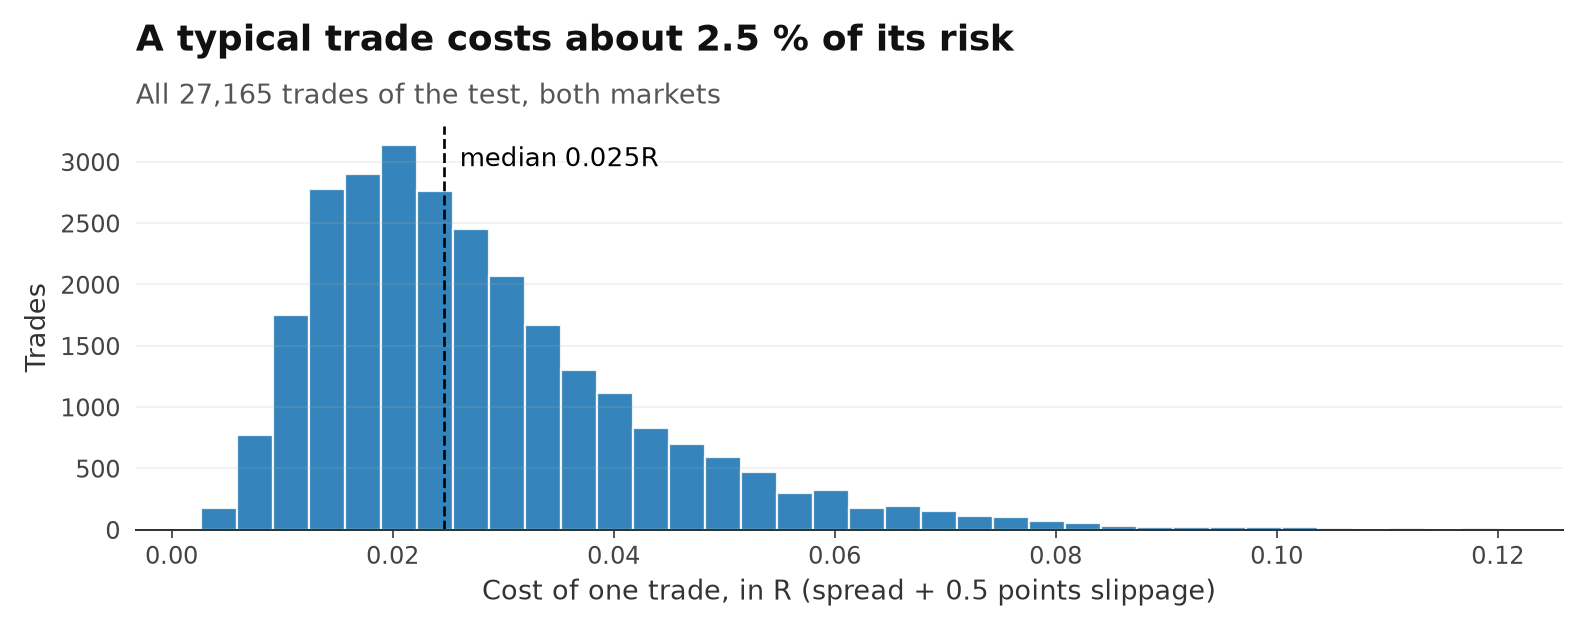
About 2.5 % of the risk sounds small. But these rules trade often, and their edge per trade is just as small:
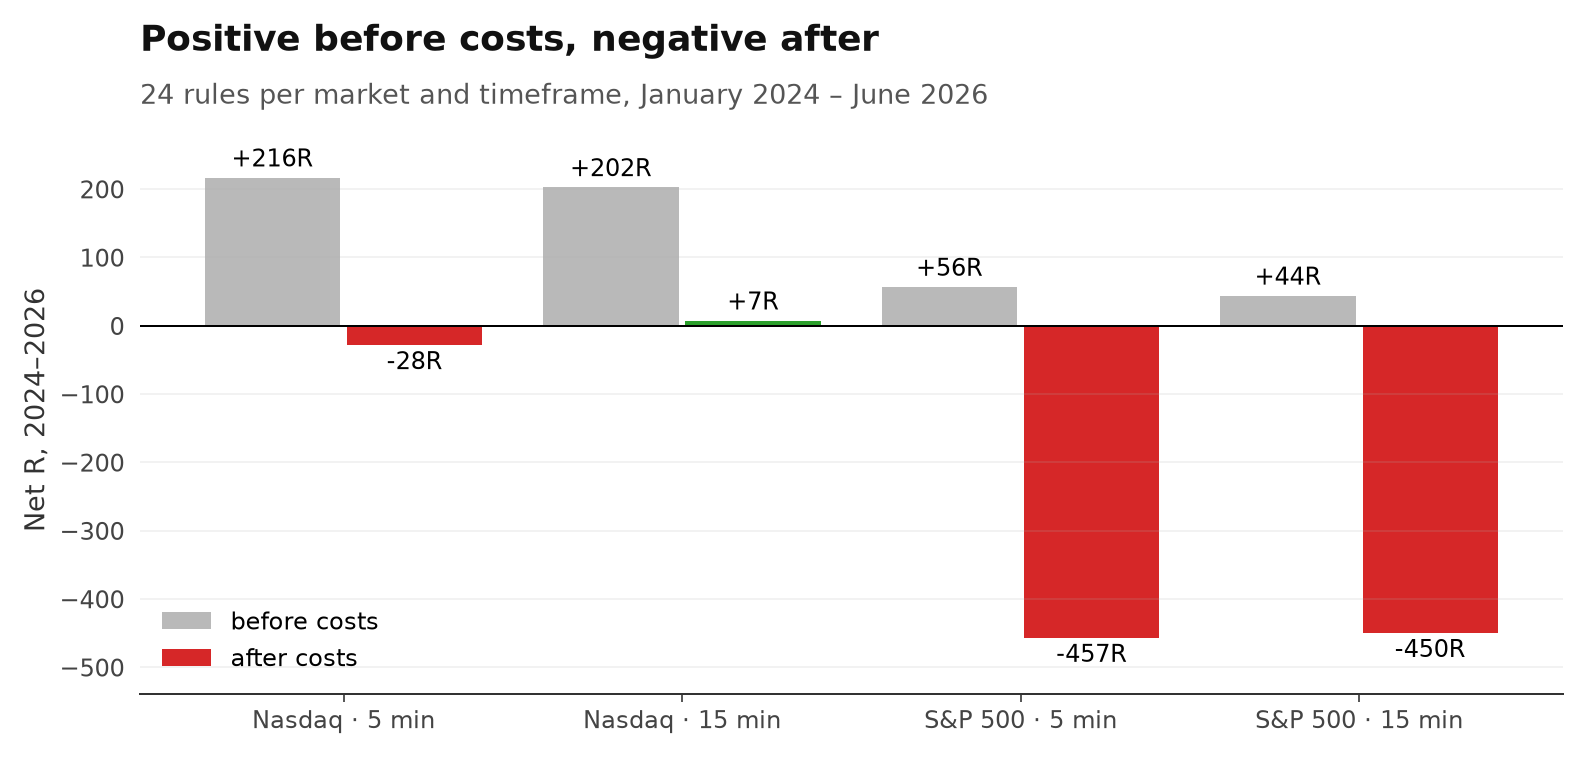
On the S&P 500 the spread is large compared to its typical moves (1.11 points against an ATR of 11.1). That alone turned a small profit into a loss of about 450R on each timeframe.
05Build first, judge later
Rules were set up on 2020–2023, then frozen. Only 2024–2026 counts.
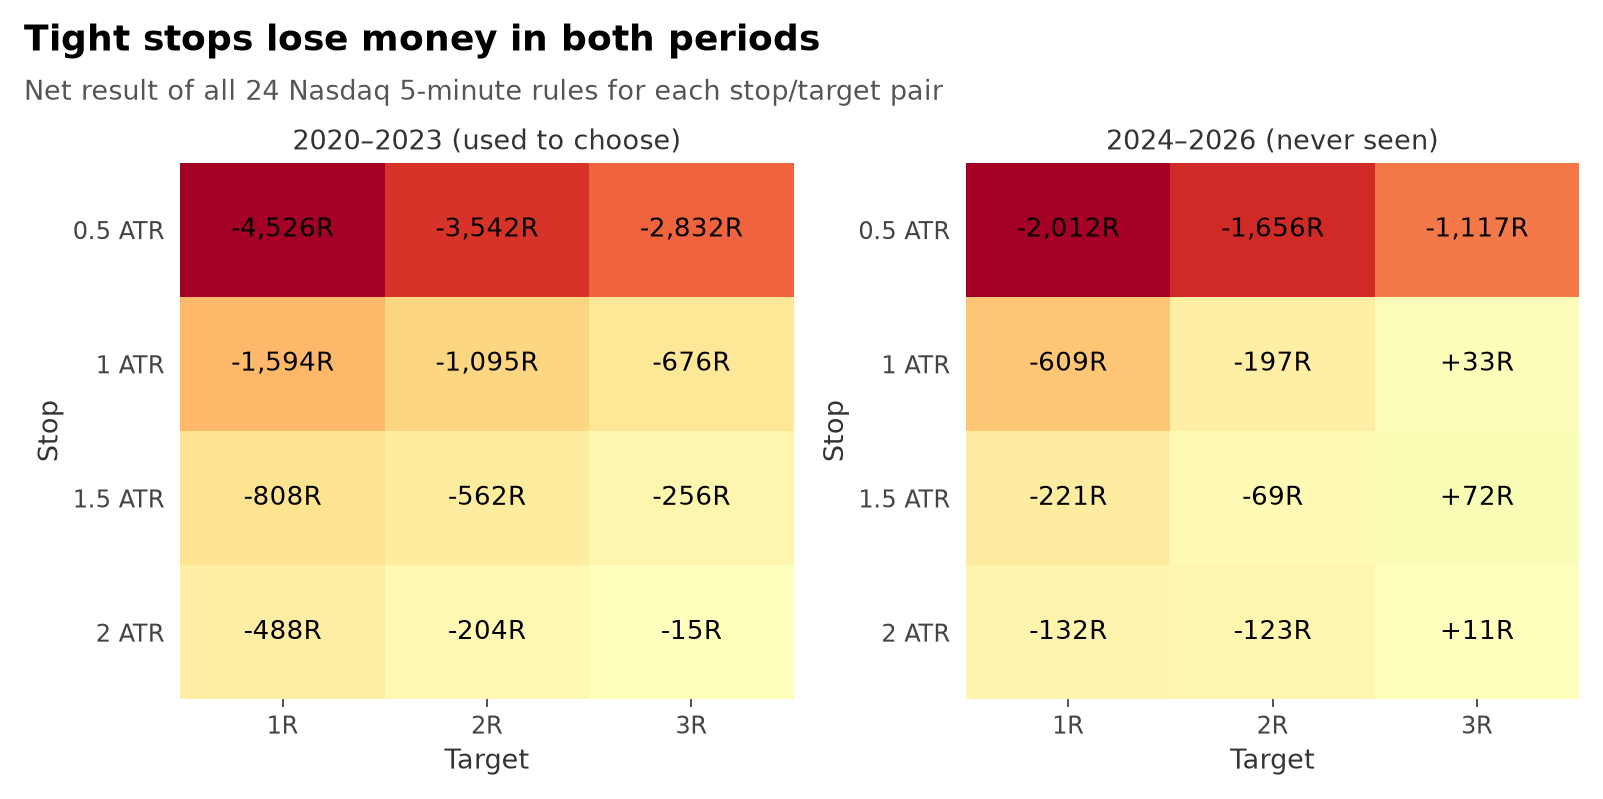
Each rule could choose from 12 stop/target pairs. If you pick the best pair and show its result, you're showing luck.
So each rule picked its stop and target on 2020–2023 only. Then it was frozen and tested on 2024 – June 2026 — data it had never seen.
06The random test
A rule only counts if it beats random trades in the same direction.
The Nasdaq rose a lot in 2024–2026. Almost any long trade made money. So "it made money" proves nothing.
That's why every rule was compared with 1,000 random copies of itself: same number of trades, same direction, same stop and target, same session — but random entry times.
p = 0.05 means 1 in 20 random copies did as well as the rule. The lower, the less likely it's luck.
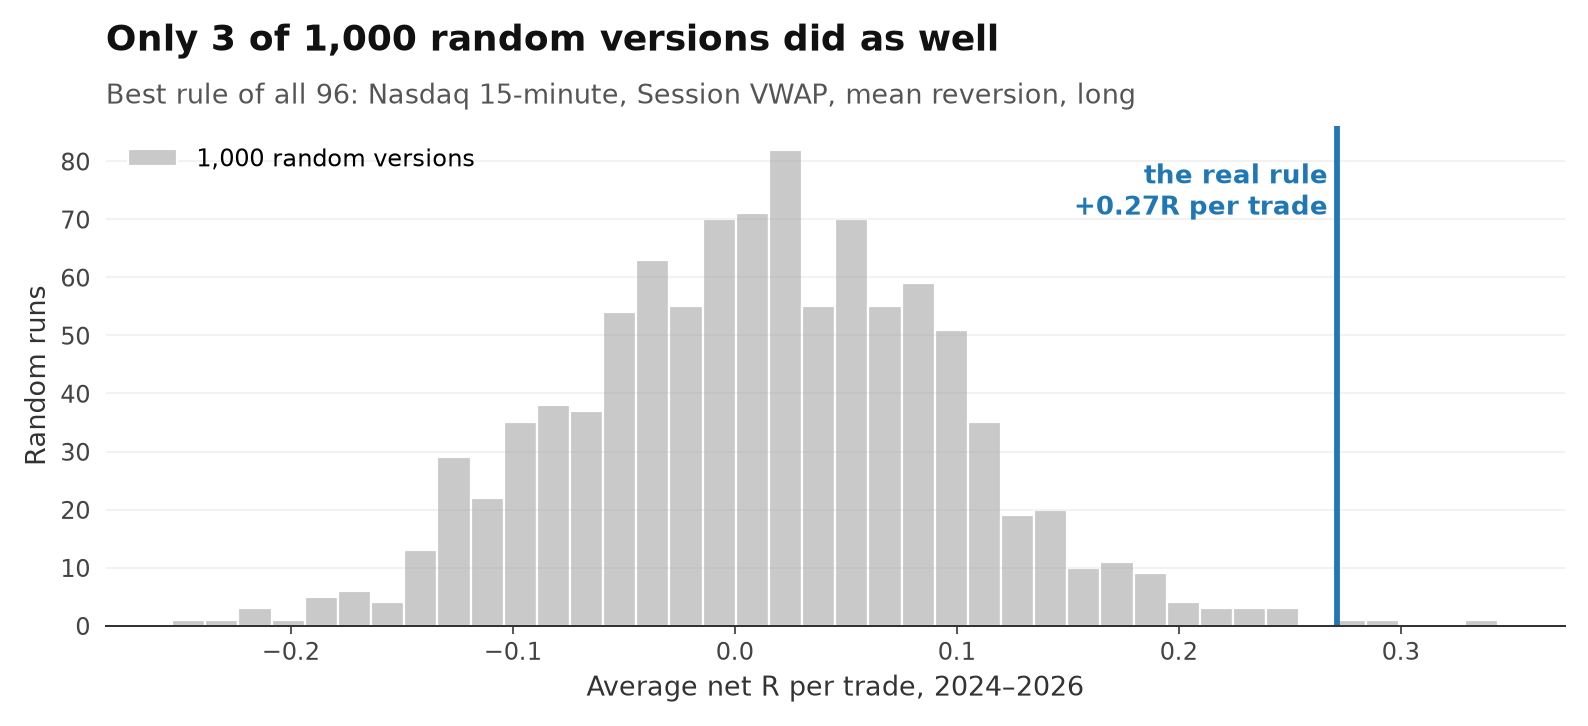
That looks strong. But it is the best of 96 — and that matters, as section 8 shows.
07Which VWAP?
No anchor made money across markets. The popular swing-anchored VWAP was the worst.
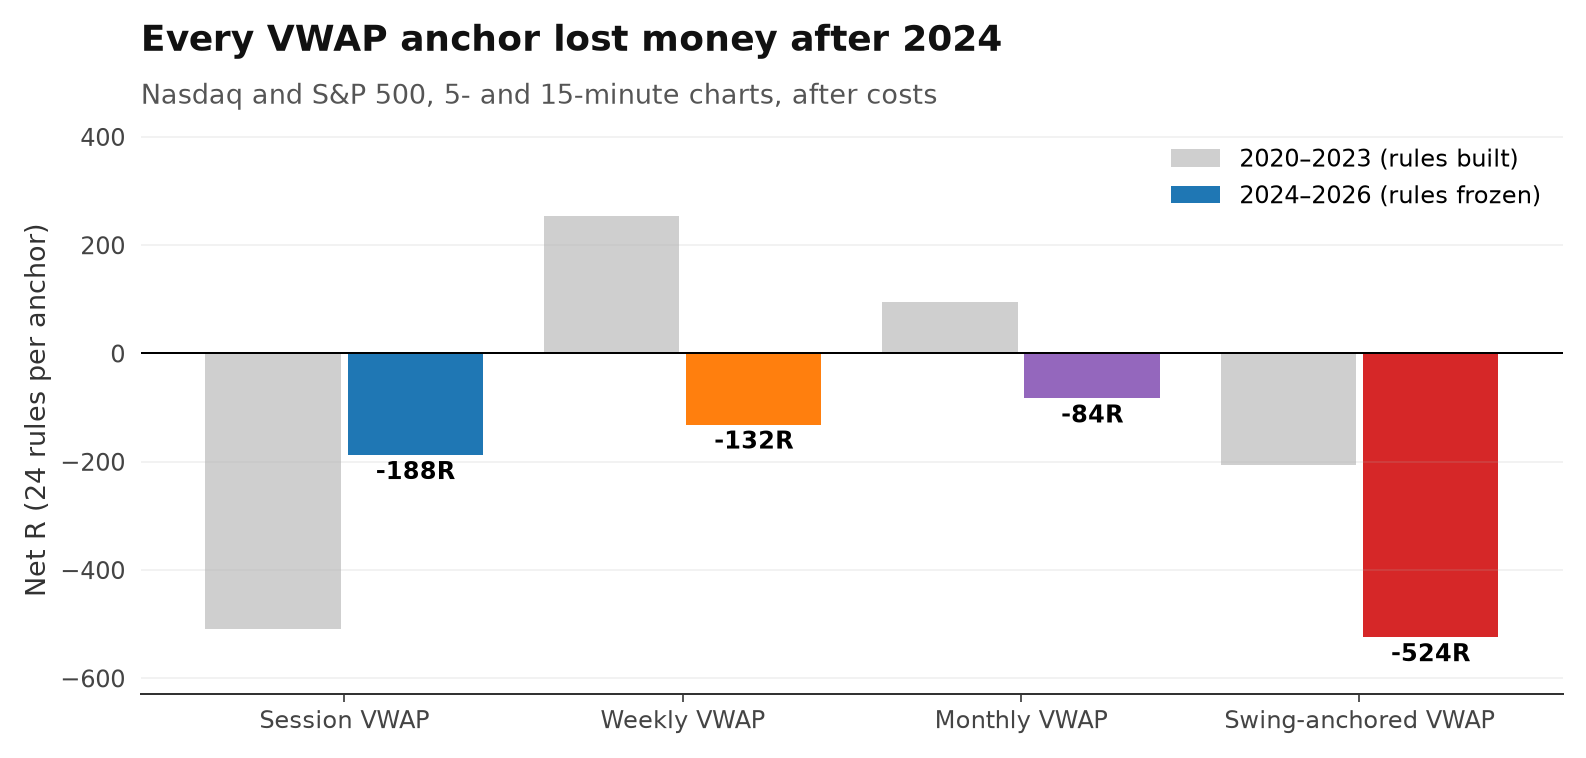
| 2024–2026, all markets | Trades | Before costs | After costs |
|---|---|---|---|
| Session VWAP | 13,231 | +282R | -188R |
| Weekly VWAP | 8,460 | +236R | -132R |
| Monthly VWAP | 4,192 | +69R | -84R |
| Swing-anchored VWAP | 11,680 | -68R | -524R |
On the Nasdaq 5-minute chart alone, the picture is friendlier: session VWAP +37.3R, weekly +21.8R. But none of them beat random entries there either.
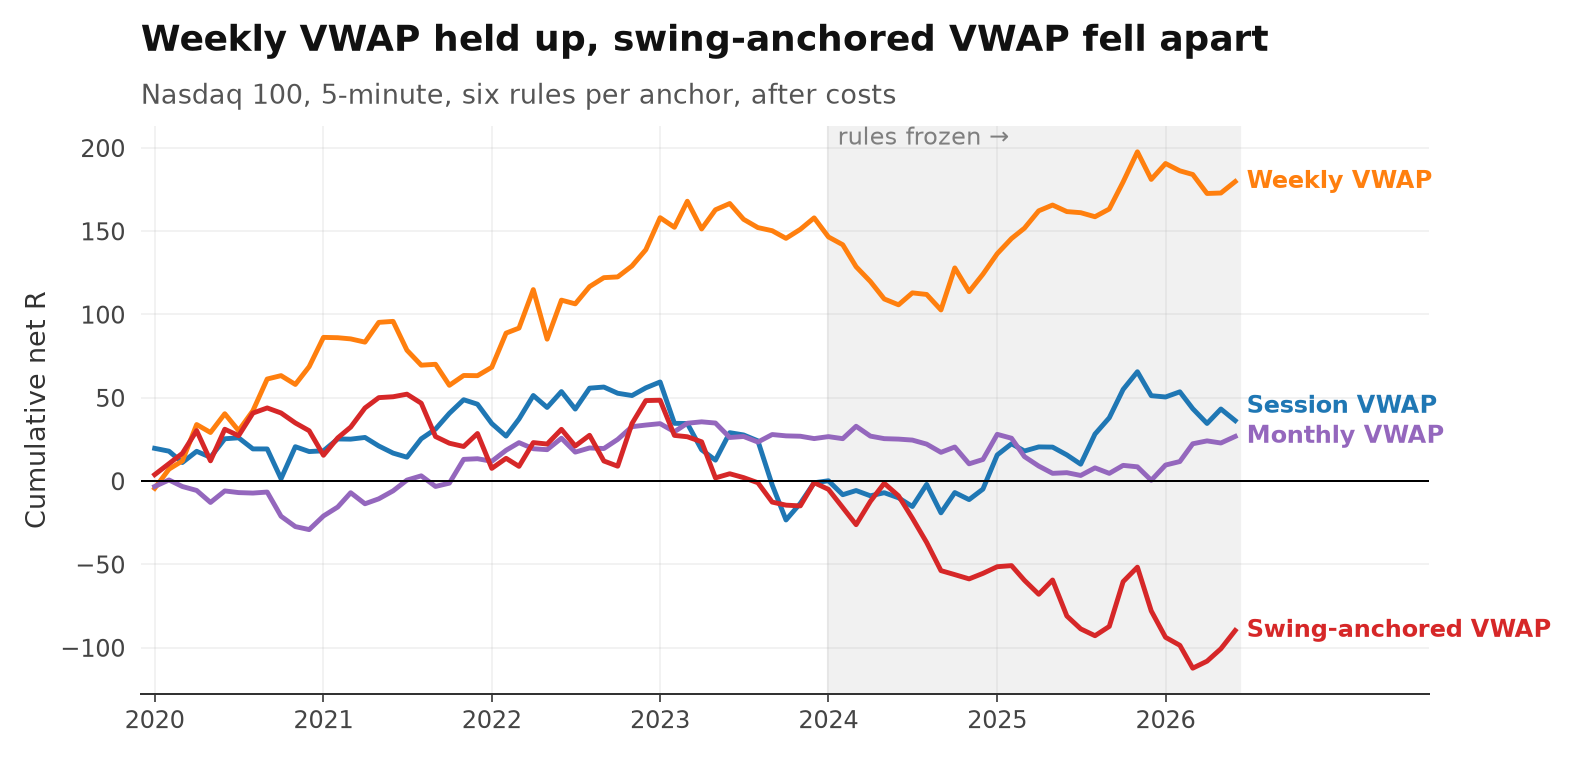
08All 96 rules at once
Test 96 rules and about 5 will look good by pure luck. We found 8.
If VWAP had a real edge, most rules would beat random entries — the bars below would pile up on the left. They don't. They're spread out almost evenly, exactly like chance.
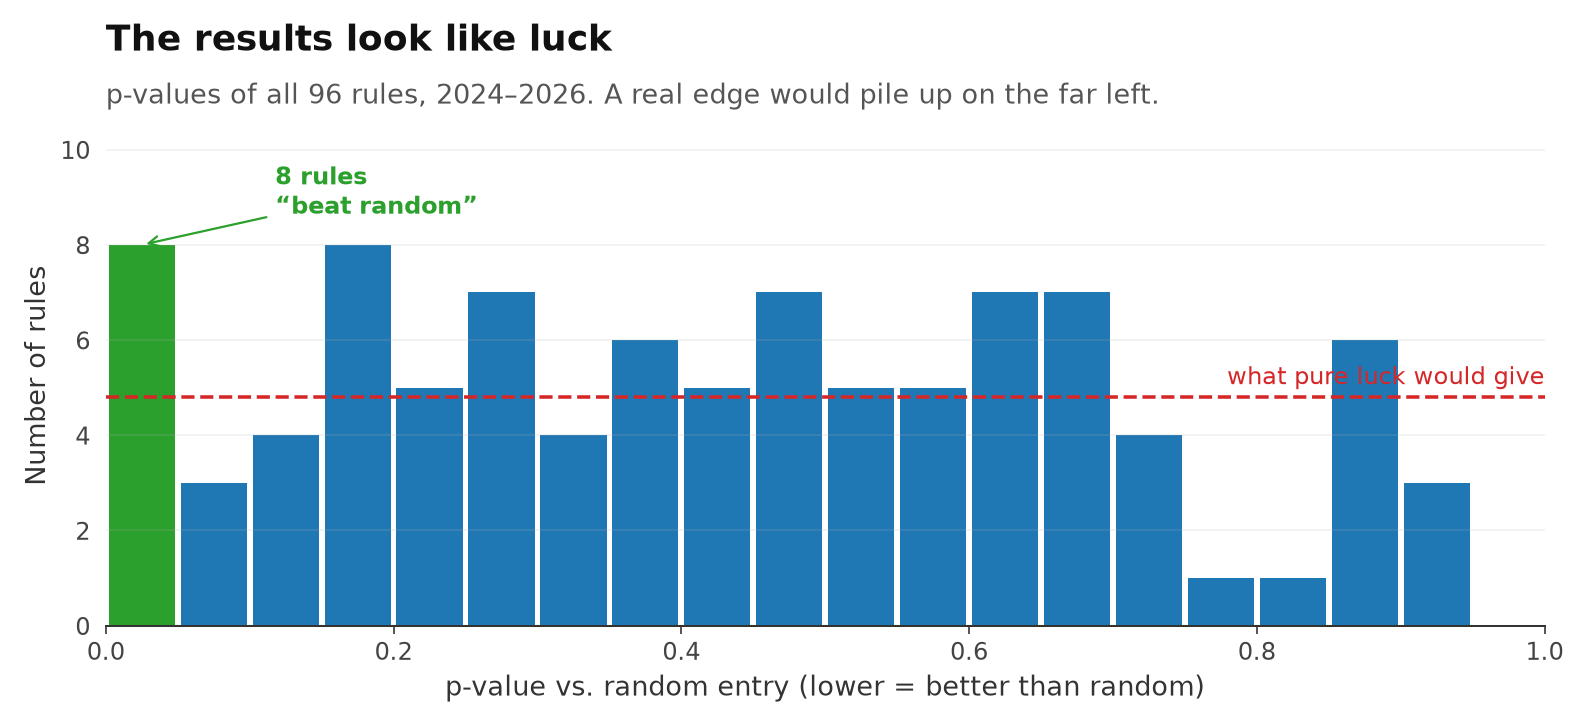
That also explains the best rule from section 6: among 96 tries, one result that strong is about what you'd expect.
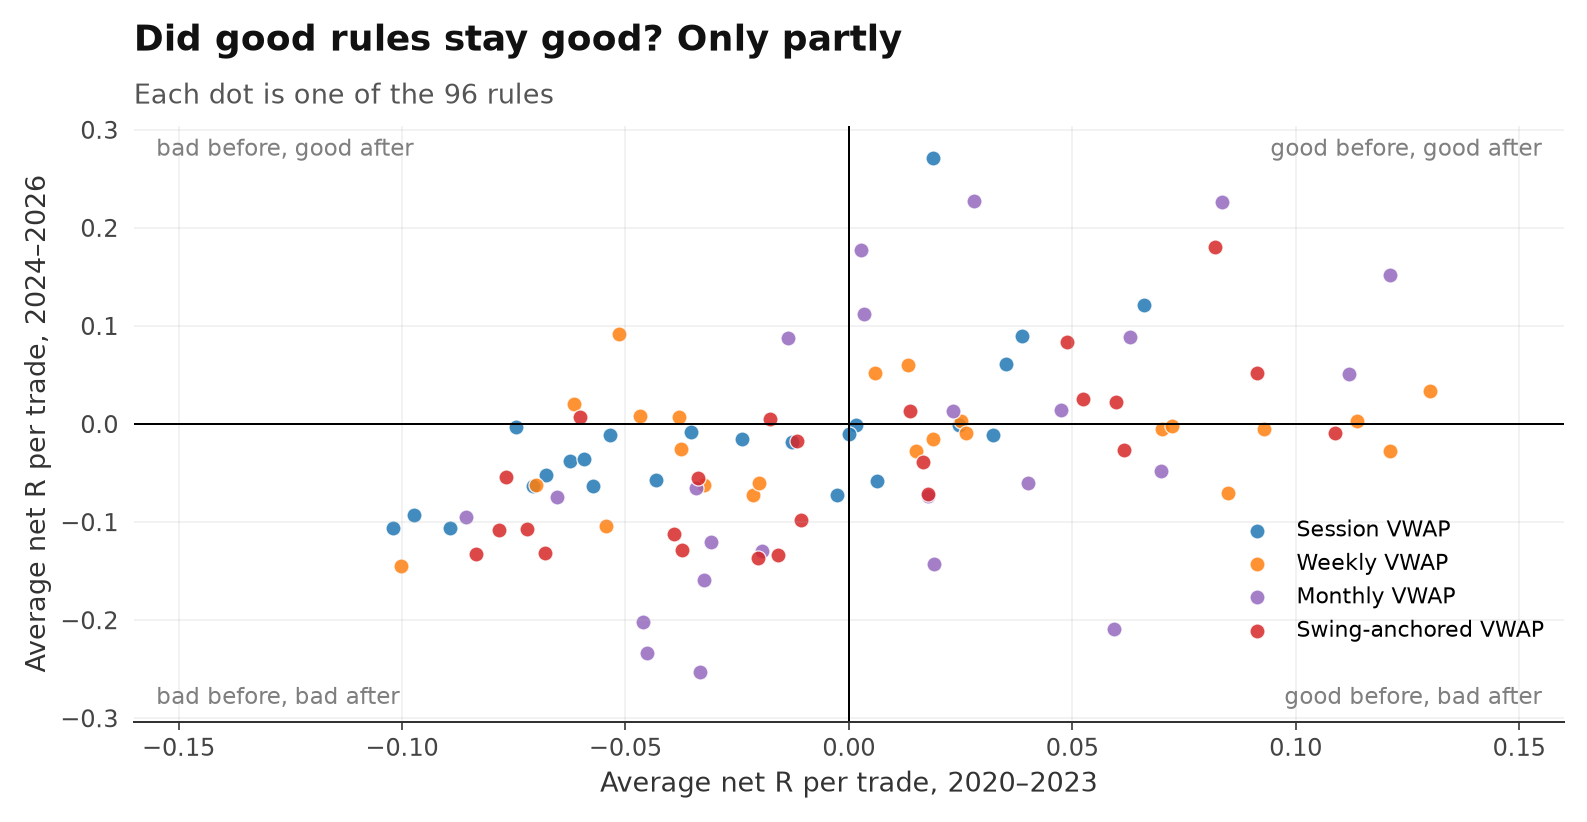
To be fair: rules that did well before 2024 did tend to do better after. But of the 46 rules that were profitable before 2024, only 24 stayed profitable. That's a coin flip.
The strongest results share a pattern: long, mostly mean reversion, mostly on the Nasdaq — buying a stretched market back towards VWAP. That's a hypothesis worth its own test, not a system to trade.
09Verdict
As an entry signal, VWAP did not beat chance after costs — for any anchor, any of the three uses, any market or timeframe.
VWAP still has value as context: it shows where the average trader of a period is positioned. But "price respects VWAP, trade the bounce" did not hold up on 37,563 out-of-sample trades.
If you trade VWAP
- Check costs against your stop. With a tight stop, the spread alone kills most rules.
- Don't pick the anchor that looks best. Every anchor looks best on some chart.
- Compare with random entries. In a rising market, a profit proves nothing.
10Limitations
- Volume is the broker's tick volume, not exchange volume.
- The cost model is calibrated on the Nasdaq and is relatively harsher on the S&P 500.
- January 2020 – June 2026 is mostly one bull market. The Dow Jones was not tested.
- Mean reversion exits at a fixed target, not at VWAP itself.
- One swing definition (5 hours each side); others were not tested.
The 60-second version
This study started as a Reel. Share it with someone who still trades the VWAP bounce.
Next in the research library
- Do fair value gaps actually work? We tested almost 100,000 No usable edge
- Can one 5-minute candle predict the next six hours? Yes — the direction carries
- Does the double top pattern actually work? Worse than random
- Do Bollinger Bands actually predict reversals? in the lab
- Does Fibonacci actually work in trading? in the lab
- Does the weather in New York actually affect the Nasdaq? in the lab