Does the opening range breakout have an edge on the Nasdaq?
We traded the first breakout after the US open on 1,616 Nasdaq days — with a 15, 30 and 60-minute range, 4,725 trades in total — and compared every version against random entries.
01What an opening range breakout is
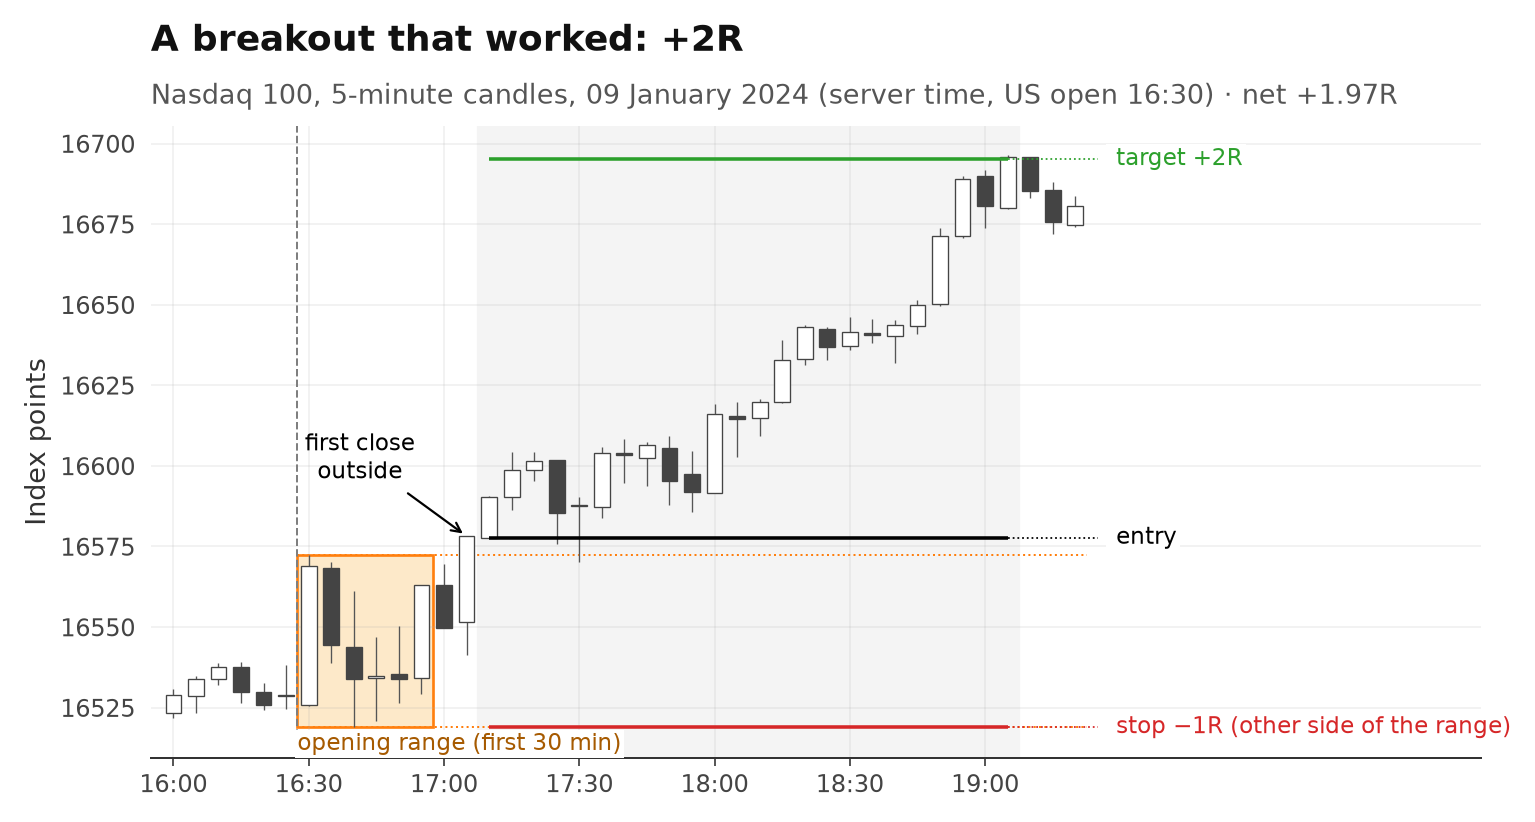
Mark the high and low of the first minutes after the open. Trade in the direction price breaks out.
The first minutes after the US stock market opens are the busiest of the day. The idea behind the opening range breakout (ORB): that early high and low show where buyers and sellers stand. When price leaves that range, it should keep going.
So you wait. You draw a box around the first 15, 30 or 60 minutes. When a candle closes above the box, you buy. When it closes below, you sell. Your stop goes on the other side of the box.
02What we tested
One rule, three range lengths, two targets — on the Nasdaq 100, every trading day from 2020 to June 2026.
The opening is 9:30 New York time. Our broker data runs on server time, where that is 16:30 all year round.
- Range — high and low of the first 15, 30 or 60 minutes (3, 6 or 12 five-minute candles)
- Signal — the first five-minute candle after the range that closes outside it
- Direction — long above the range, short below. One trade per day at most
- Target — 1R or 2R (see section 5 for how one was picked)
Not every breakout works. About half the time it looks like this:
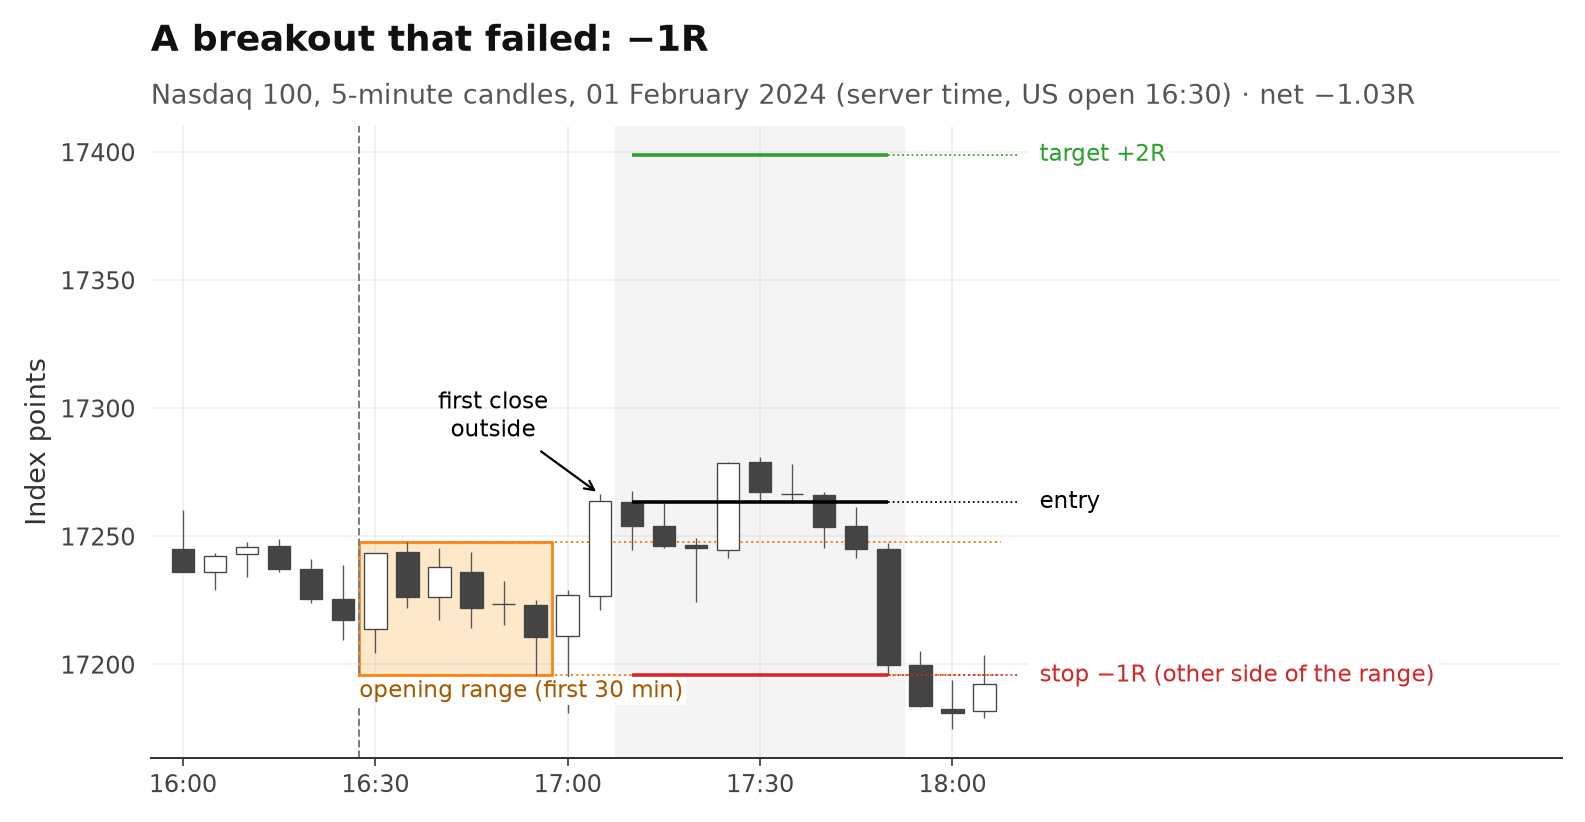
About half of all trades lost. The win rate of the 30-minute version was 49.4 %. The edge, if there is one, comes from winners being twice the size of losers.
03How a trade is counted
Every version follows the same mechanics. No discretion, no hindsight.
| Entry | Signal on a closed candle, entry at the open of the next candle |
|---|---|
| Stop | The opposite edge of the range. The distance from entry to stop is 1R — our unit of risk |
| Target | 1R or 2R beyond the entry |
| Time exit | At the close of the last candle before 23:00 server time (16:00 New York, the cash close) |
| Worst case | If stop and target are hit in the same candle, we count the stop. A gap through the stop fills at the open |
| Days | Days without a candle at the open or with a short session (holidays, half days) are skipped |
We measure in R, not dollars. +0.1R per trade means: on average you win a tenth of what you risk.
Because the stop sits at the other side of the range, risk changes every day. On the 30-minute range the typical stop was 110.9 index points; on the 15-minute range 89.4, on the 60-minute range 138.0.
04Costs
Costs are small per trade here — but they still took almost half of the profit.
Every trade pays the real spread at entry plus 0.5 points slippage — about 2.0 points on a typical day. Against a typical stop of 110.9 points that is cheap:
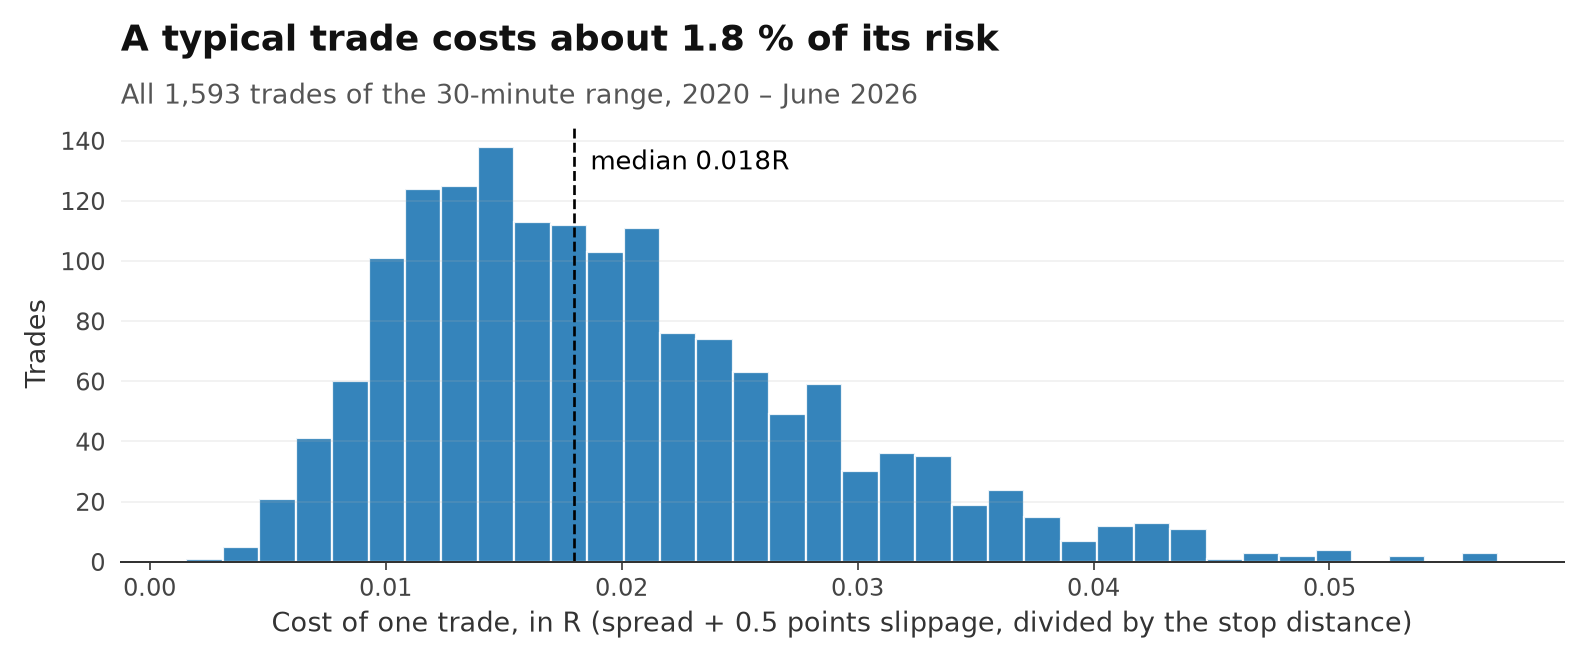
Cheap, but not free. Before costs the 30-minute version made +68.7R; after costs +37.6R. That is 45 % of the profit gone. A broker with a wider spread would eat even more.
05Build first, judge later
The target was picked on 2020–2023 only. 2024 – June 2026 is the test the rules never saw.
If you try several settings and show the best one, you are showing luck. So the test was split in two:
- 2020–2023: each range length chose between a 1R and a 2R target
- 2024 – June 2026: nothing could be changed any more
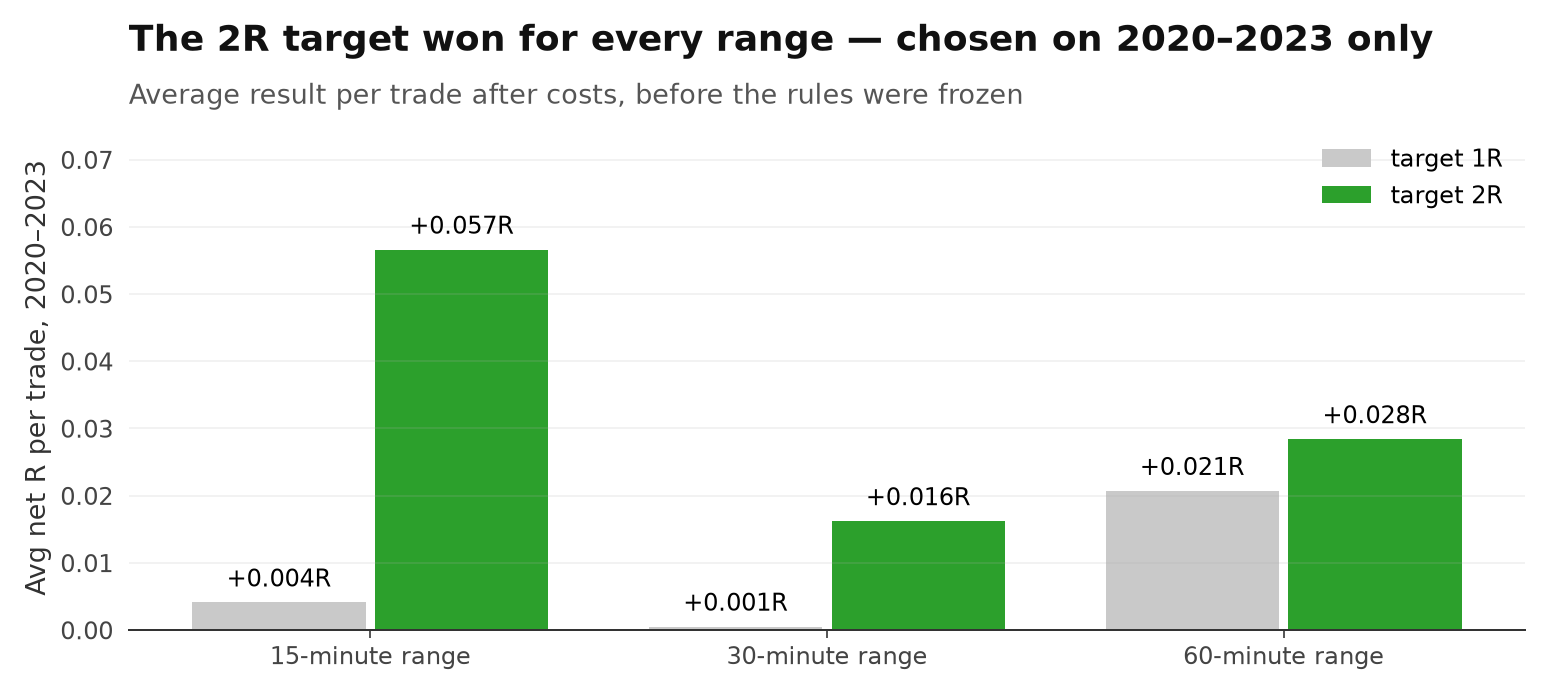
With a 1R target, the 30-minute breakout earned +0.0005R per trade in 2020–2023 — basically nothing. The 2R target did better on every range, so every version went into the test period with 2R.
06The random test
A rule only counts if it beats random trades placed in the same hours after the open.
The Nasdaq is volatile after the open. A wide target can get hit by pure noise. So "it made money" proves nothing on its own.
That's why each version was compared with 1,000 random copies of itself: same number of trades, same stop distance, same 2R target, same time exit, same costs — but a random trading day, a random five-minute candle after the range, and a random direction.
p = 0.05 means 1 in 20 random copies did as well as the rule. The lower, the less likely it's luck.
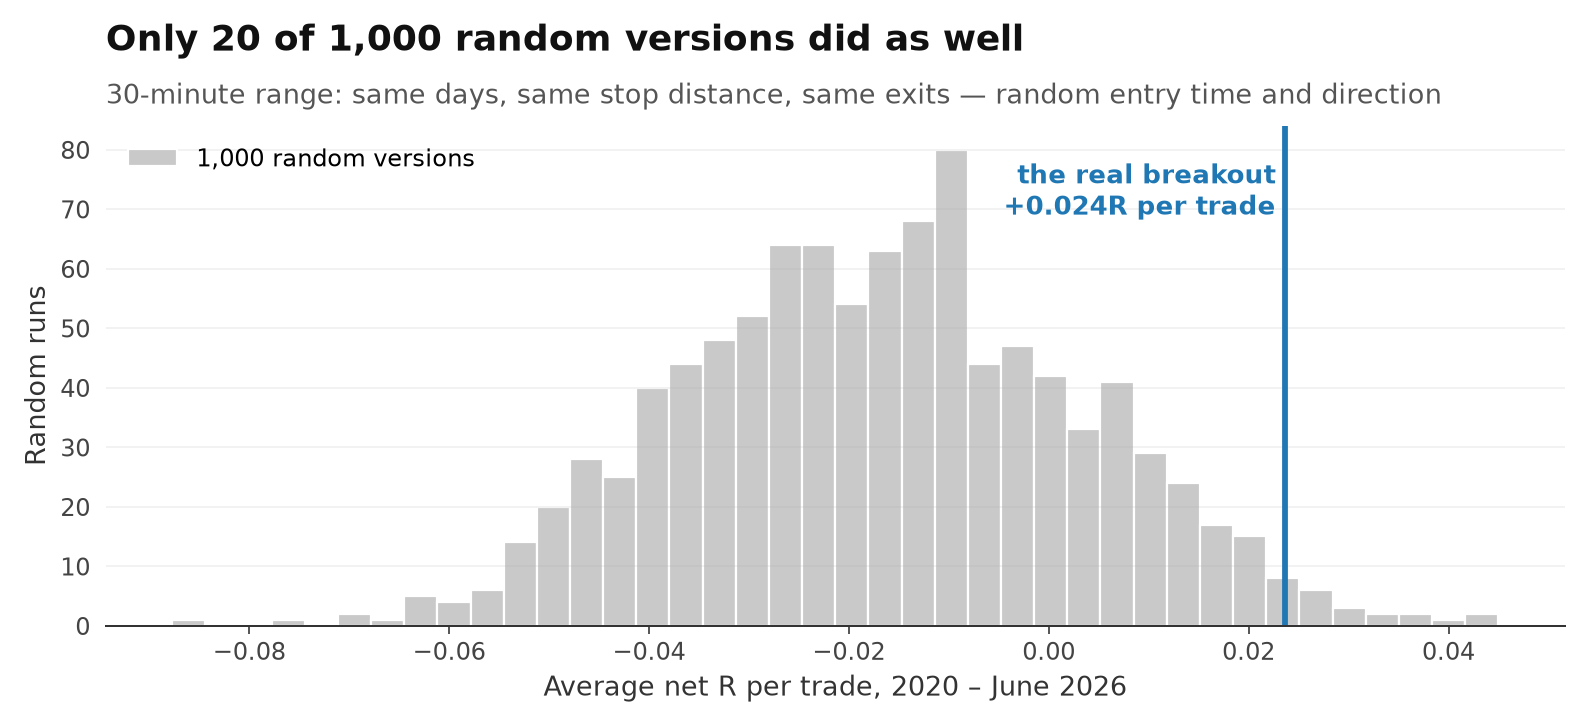
The typical random copy lost −0.016R per trade — that's the cost of trading at random. The real breakout made +0.024R. Only 20 of 1,000 random copies did as well.
07Results
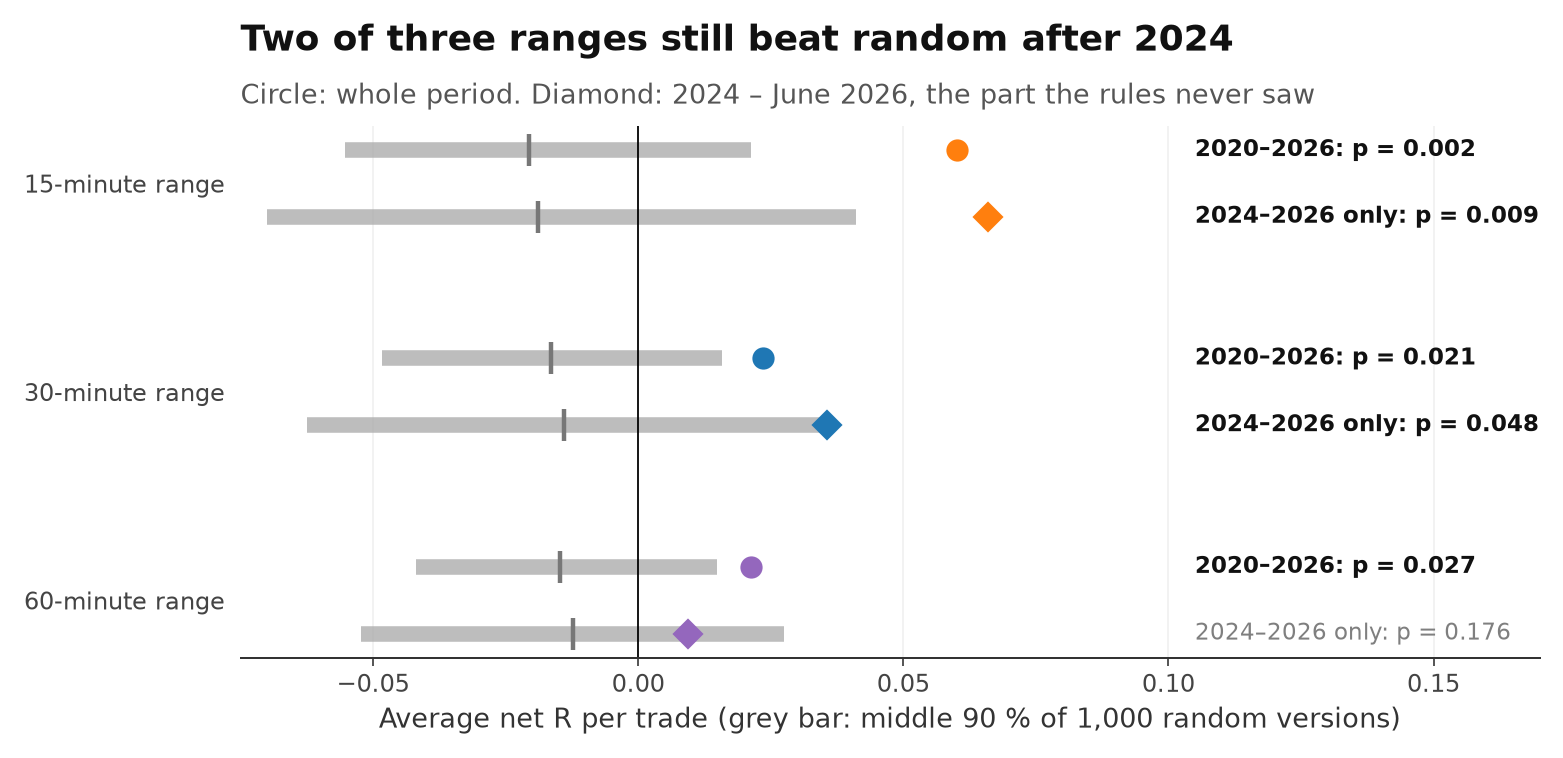
All three versions beat random over the whole period. After 2024, the 15- and 30-minute ranges still did; the 60-minute range did not.
| 2R target, after costs | Trades | Win rate | Net | Per trade | Worst drawdown | p vs. random |
|---|---|---|---|---|---|---|
| 15-minute range | 1,615 | 46.0 % | +97.1R | +0.060R | 27.3R | 0.002 |
| 30-minute range | 1,593 | 49.4 % | +37.6R | +0.024R | 25.5R | 0.021 |
| 60-minute range | 1,517 | 53.3 % | +32.1R | +0.021R | 18.0R | 0.027 |
The curves below show how that profit came about. Note the first year: all three versions lost money in 2020, and the 30-minute version only stayed above zero for good from October 2022.
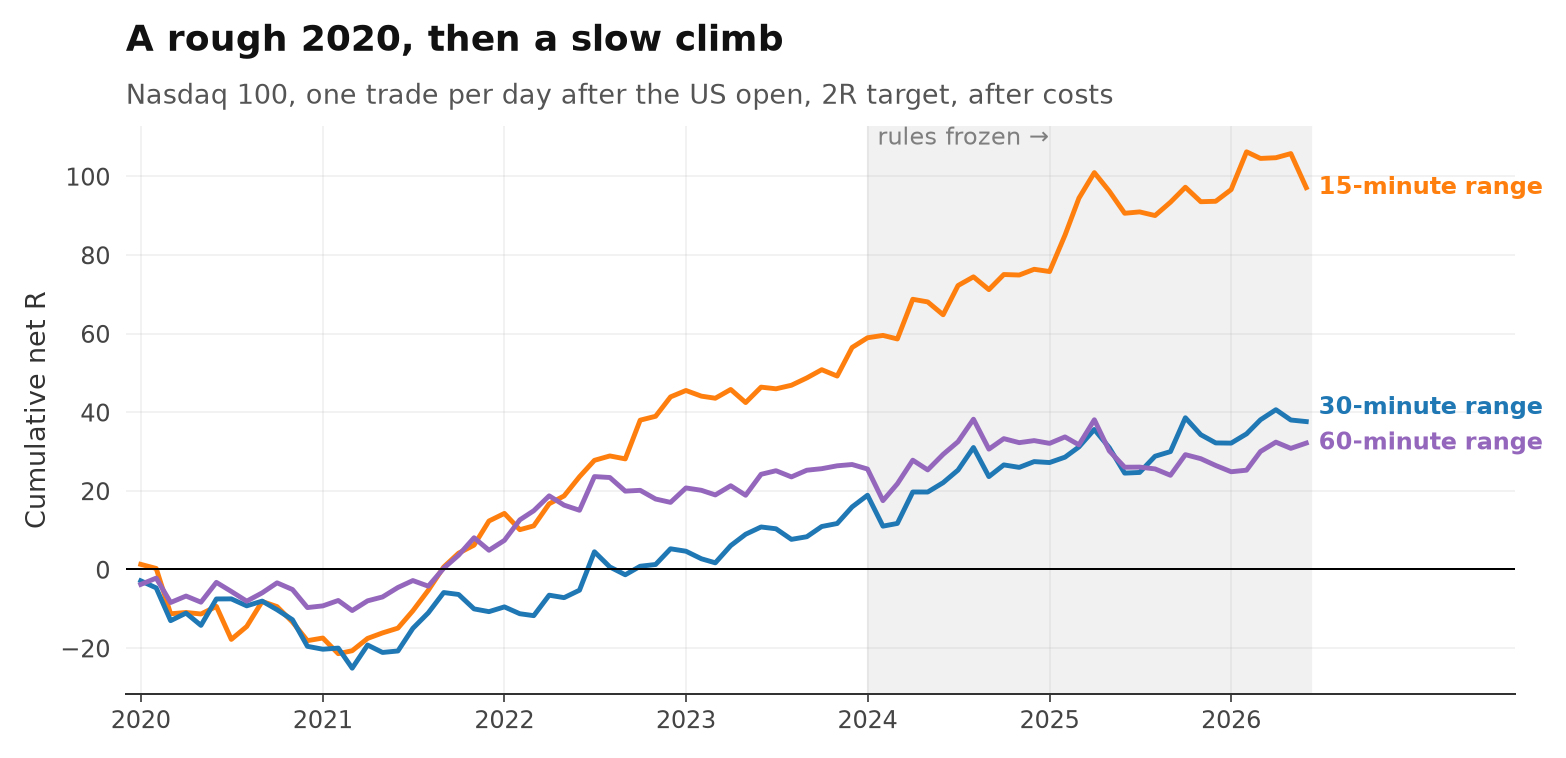
The part that matters most is the one the rules never saw. Here each version was compared against its own random copies, using only the 2024–2026 trades:
| 2024 – June 2026 only | Trades | Net | Per trade | p vs. random |
|---|---|---|---|---|
| 15-minute range | 617 | +40.7R | +0.066R | 0.009 |
| 30-minute range | 610 | +21.7R | +0.036R | 0.048 |
| 60-minute range | 578 | +5.5R | +0.009R | 0.1758 |
The 15-minute range was the strongest: +97.1R in total, p = 0.009 after 2024. The 30-minute range, fixed in advance as the main version, passed after 2024 — but only just (p = 0.048).
Because we looked at three range lengths. The best of three always looks better than it is. The honest headline is the version that was chosen before the test: the 30-minute range.
08Is it just the rising market?
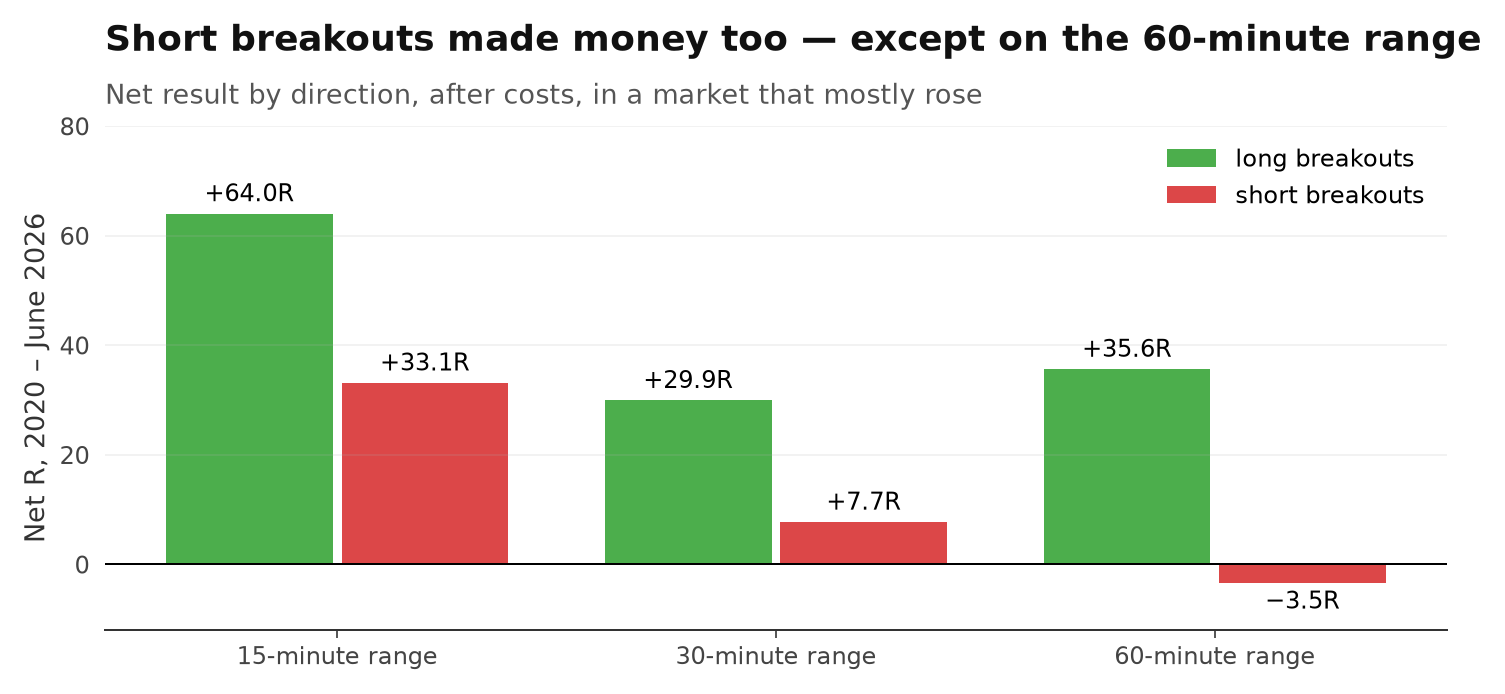
No. Short breakouts made money too, and the result held when the random copies kept the real direction.
The Nasdaq 100 rose from about 8,755 to 29,055 points between 2020 and 2026. A strategy that buys more often than it sells could look good just by riding that rise. Two checks speak against it.
First: short breakouts were profitable on their own — on the 15- and 30-minute ranges. Only the 60-minute range lost on the short side.
Second: as an extra check — not part of the original run — we repeated the random test with each random copy keeping the real trade's direction instead of a random one. The 30-minute breakout still beat it: p = 0.027 over the whole period and 0.049 after 2024.
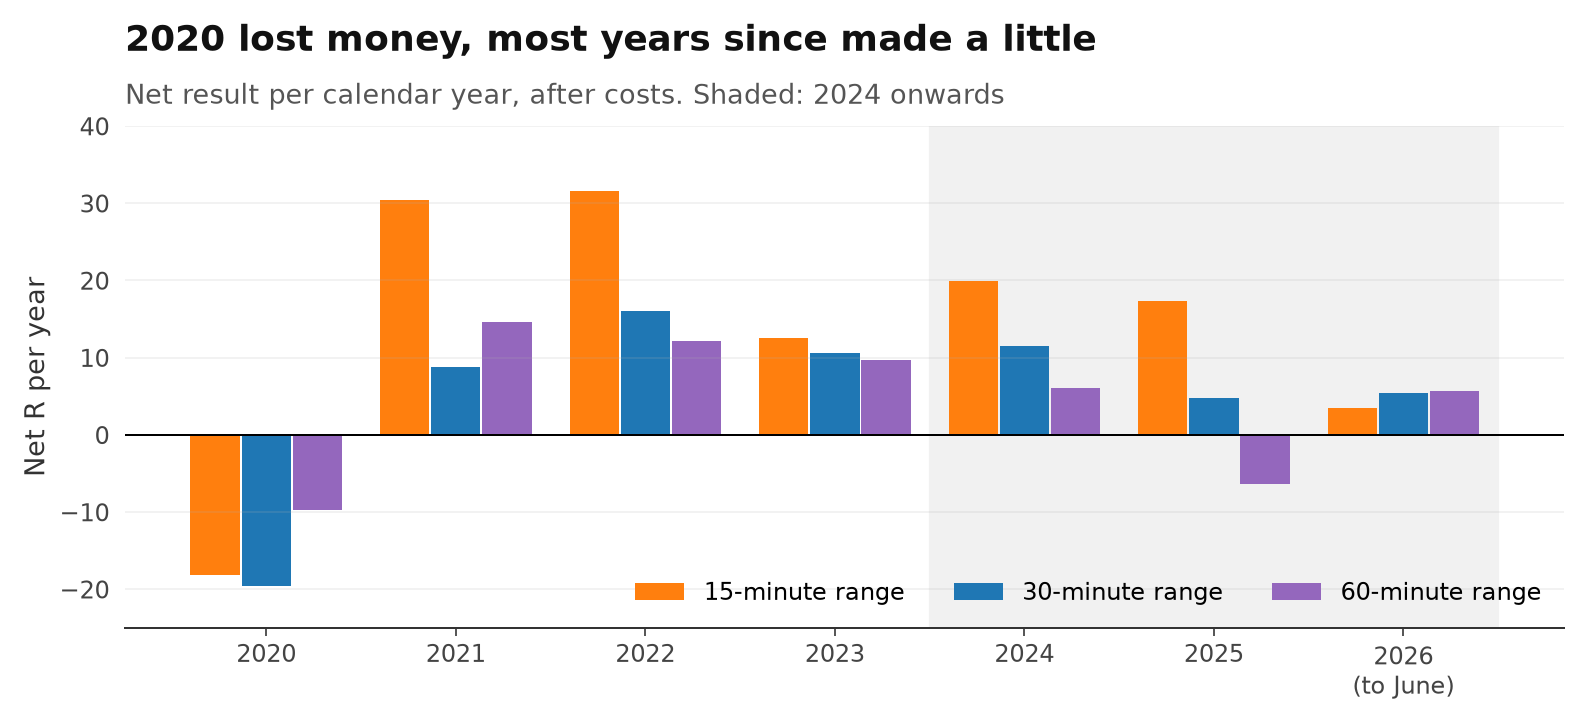
The 30-minute version was positive in 6 of 7 calendar years (2026 only to June). That is a steadier picture than one lucky year — but the yearly amounts are small.
09Verdict
On the Nasdaq, the opening range breakout with a 2R target did better than random entries after costs — over the whole period and, for the 15- and 30-minute ranges, after 2024 as well.
That is a rare result in this library. But keep the size in mind: +0.024R per trade for the main version. One day's slippage, a wider spread or a missed entry is enough to wipe that out. And the worst drawdown was 25.5R — more than a year of profits.
If you trade the opening range breakout
- Wait for a close outside the range. That is what was tested — not a touch of the high or low.
- Let winners run to 2R. With a 1R target the edge was close to zero before 2024.
- Check your costs. Costs already took 45 % of the profit here.
- Expect long dry spells. 2020 lost money for every version.
10Limitations
- One market (Nasdaq 100 CFD) and one broker's prices. Other indices and futures were not tested.
- Five-minute candles, no tick data. When stop and target fall in the same candle, the stop is counted.
- The three range lengths trade the same days and are not independent tests.
- 2020 – June 2026 is mostly one bull market; the out-of-sample part is only about two and a half years.
- The random copies use random trading days, not the same day as the real trade.
- No news filter, no volatility filter, no trailing stop — those were not tested.
The 60-second version
This study started as a Reel. Share it with someone who trades the open.
Next in the research library
- Do fair value gaps actually work? We tested almost 100,000 No usable edge
- Can one 5-minute candle predict the next six hours? Yes — the direction carries
- Does the double top pattern actually work? Worse than random
- Do Bollinger Bands actually predict reversals? in the lab
- Does Fibonacci actually work in trading? in the lab
- Does the weather in New York actually affect the Nasdaq? in the lab