Does the Ichimoku cloud actually give you an edge?
We turned the three classic Ichimoku signals into exact rules, traded them on the Nasdaq 100 and gold — 20,901 trades on three timeframes — and compared every one with random entries, before and after 2024.
01What the Ichimoku cloud is
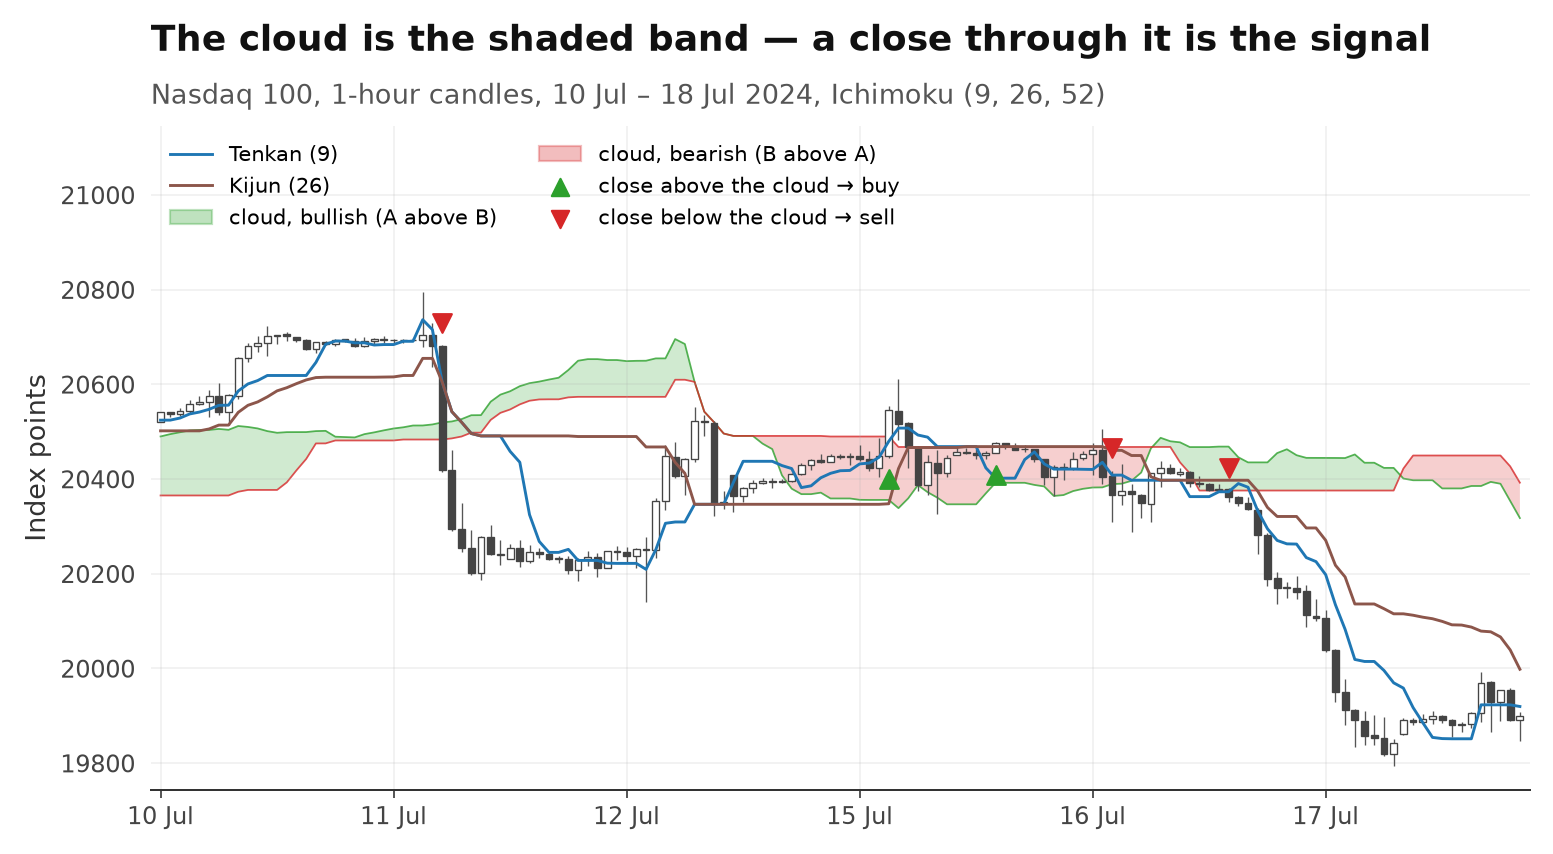
Ichimoku draws five lines from recent highs and lows. Two of them, shifted 26 candles forward, form the cloud.
The cloud is the shaded band between Senkou A and B. When A is above B, the cloud is called bullish (green); the other way round, bearish (red).
The textbook reading: price above the cloud is an uptrend, price below it a downtrend, price inside it is "no man's land". A close through the cloud is the classic entry signal.
Because the cloud is shifted forward, at any moment it is built only from prices that are already 26 candles old. Nothing in our test looks into the future.
02What we tested
Three ways traders use the cloud, written down as exact rules before any result was known. Nothing was tuned.
- Rule A — price crosses the cloud. Buy when a candle closes above the top of the cloud; sell short when it closes below the bottom.
- Rule B — Tenkan/Kijun cross. Buy when the fast line (Tenkan) crosses above the slow line (Kijun); sell when it crosses below. Where the cloud is doesn't matter.
- Rule C — confirmed breakout. Rule A, but only if the cloud ahead has the matching colour and the Chikou agrees (close above the close 26 candles ago for a buy, below for a sell). This is the "all lights green" version many courses teach.
Every rule used the default settings (9, 26, 52), the same stop and the same exit. We ran it on two markets and three timeframes:
Markets: Nasdaq 100 and gold (XAU/USD). Timeframes: 15 minutes, 1 hour, 4 hours. Results are shown with both markets pooled — 9 variants in total. Rule A on the 1-hour chart was set as the main test before any result was known.
03How a trade is counted
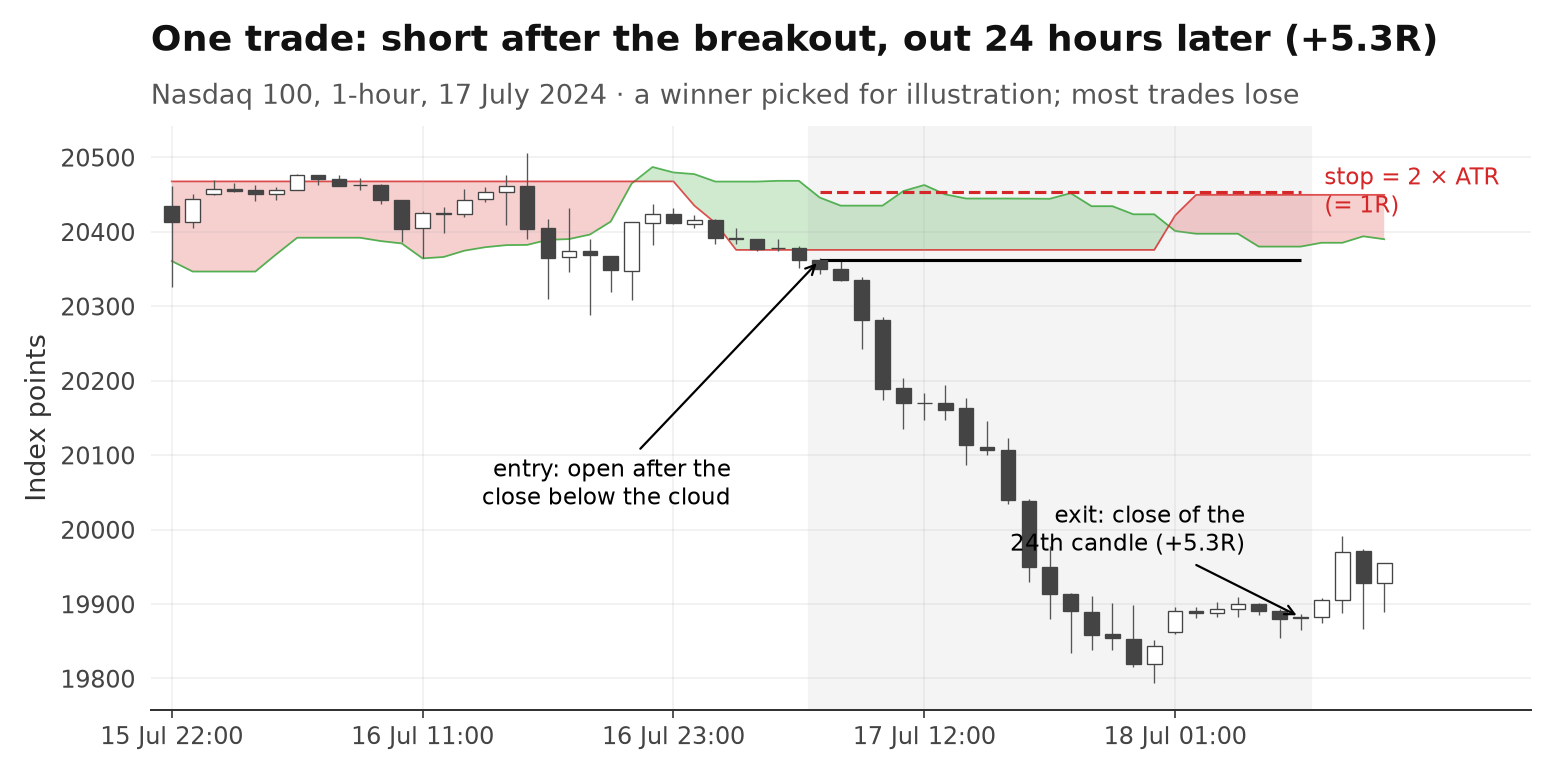
A signal is only known once the candle has closed. So every trade enters at the open of the next candle.
| Entry | Signal on a closed candle, entry at the open of the next candle |
|---|---|
| Stop | 2 × ATR(14) of the signal candle away from the entry. This distance is 1R |
| Exit | Close of the 24th candle — 6 hours on 15 minutes, a day on 1 hour, four days on 4 hours. No profit target |
| Same candle | If the stop and the exit fall in the same candle, the stop counts |
| Overlap | One position at a time per market; signals during an open trade are skipped |
We measure in R, not dollars. +0.1R per trade means: on average you win a tenth of what you risk.
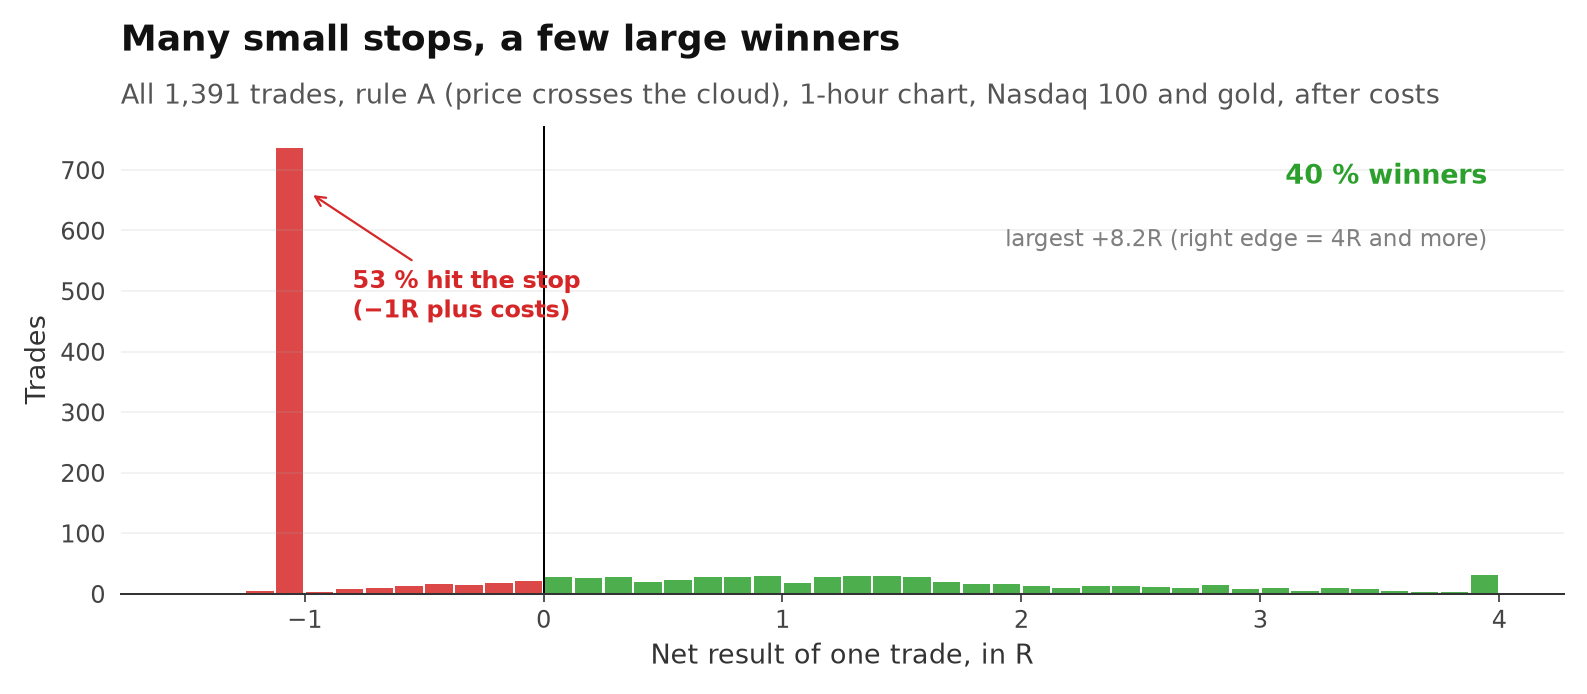
The result is a typical trend-following shape: more than half of all trades are stopped out, and a small group of big moves pays for them.
04Costs
On the 1-hour and 4-hour charts costs take a slice. On the 15-minute chart they take everything.
Every trade pays the real spread at entry plus 0.5 price units slippage (0.5 index points on the Nasdaq, $0.50 on gold). For Rule A on the 1-hour chart that is a median of 1.9 % of the risk on the Nasdaq and 5.0 % on gold.
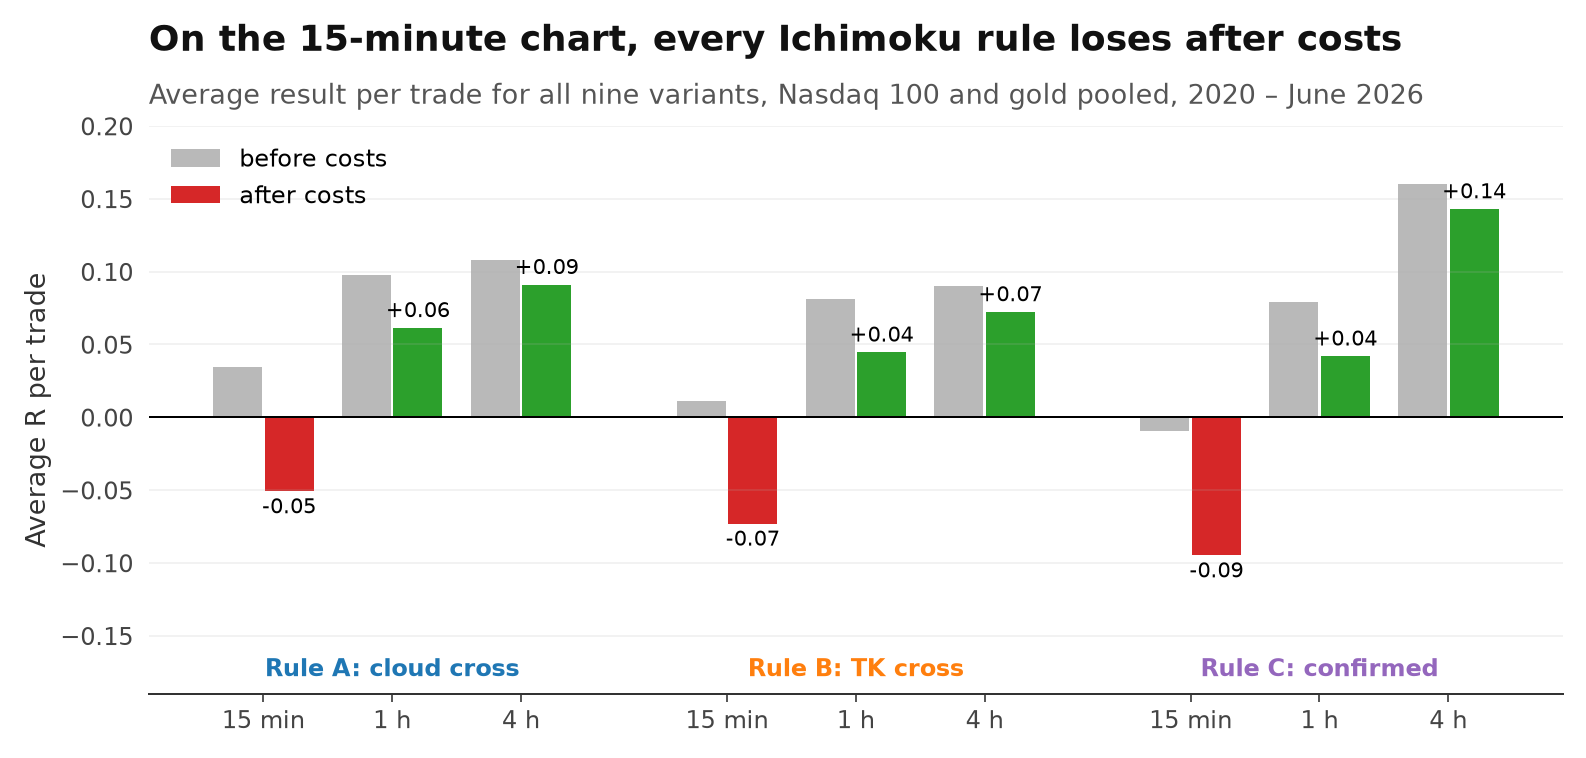
On the 15-minute chart the stop is small, so the same costs weigh far more. Rule A went from +0.034R before costs to -0.051R after. All 3 fast variants lost money — Rule C even before costs.
05Build first, judge later
2020–2023 is the period anyone could have looked at. Only 2024–2026 shows whether it lasts.
We split the data in two. 2020–2023 is the "looks good on the chart" period. 2024 – June 2026 is the test: what would have happened if you had started trading after seeing those first four years.
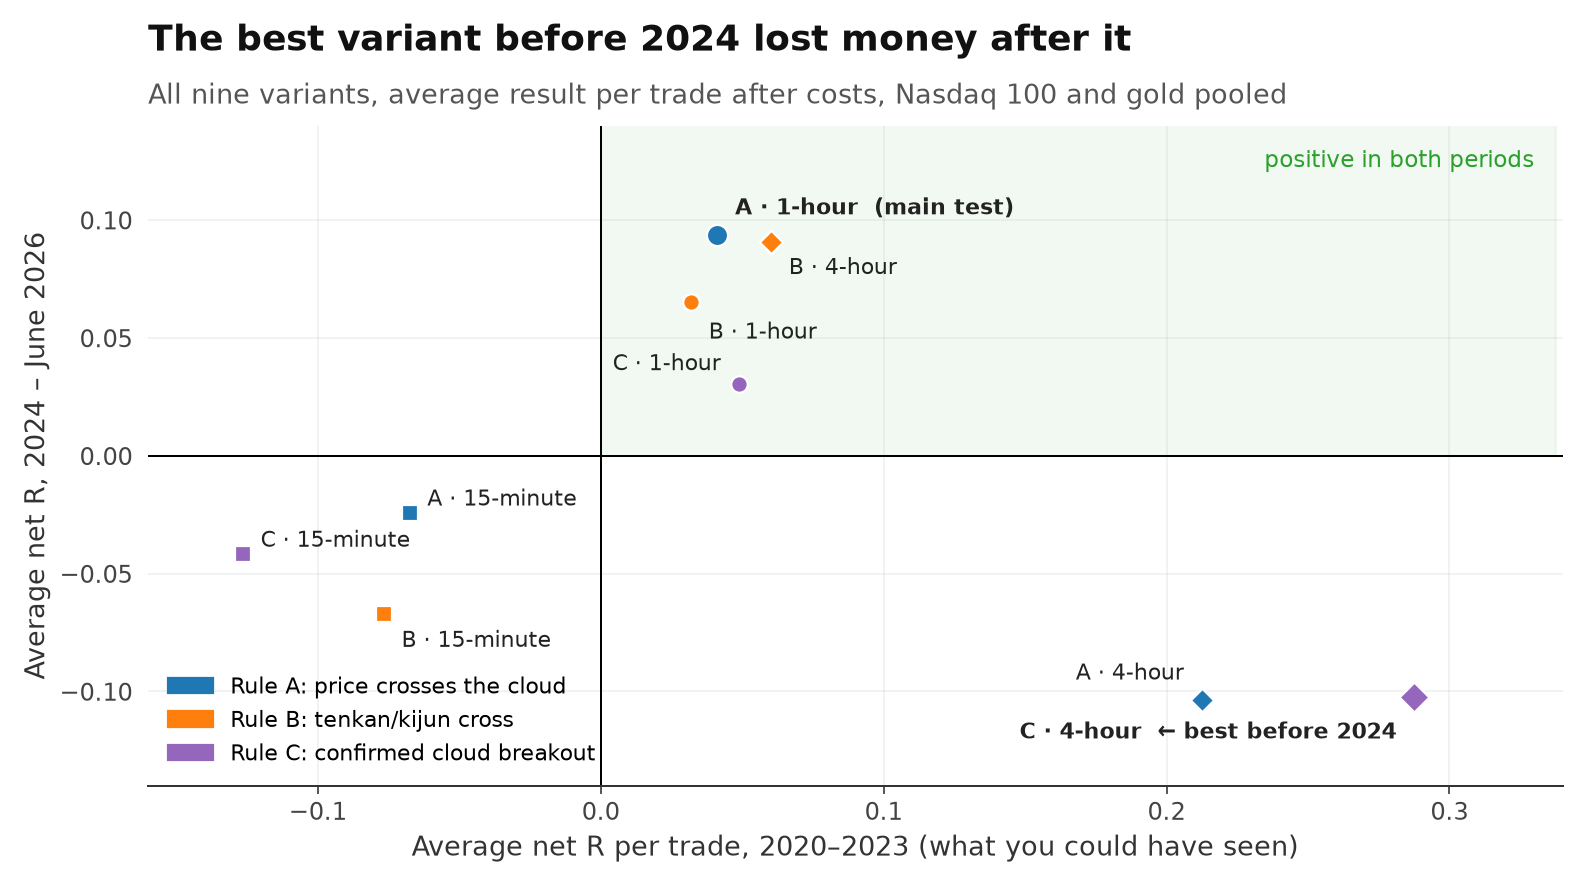
Before 2024, the best variant was Rule C on the 4-hour chart: +0.288R per trade after costs, better than 97.8 % of its random versions. That is the version you would have picked: every Ichimoku condition lined up, on a slow chart.
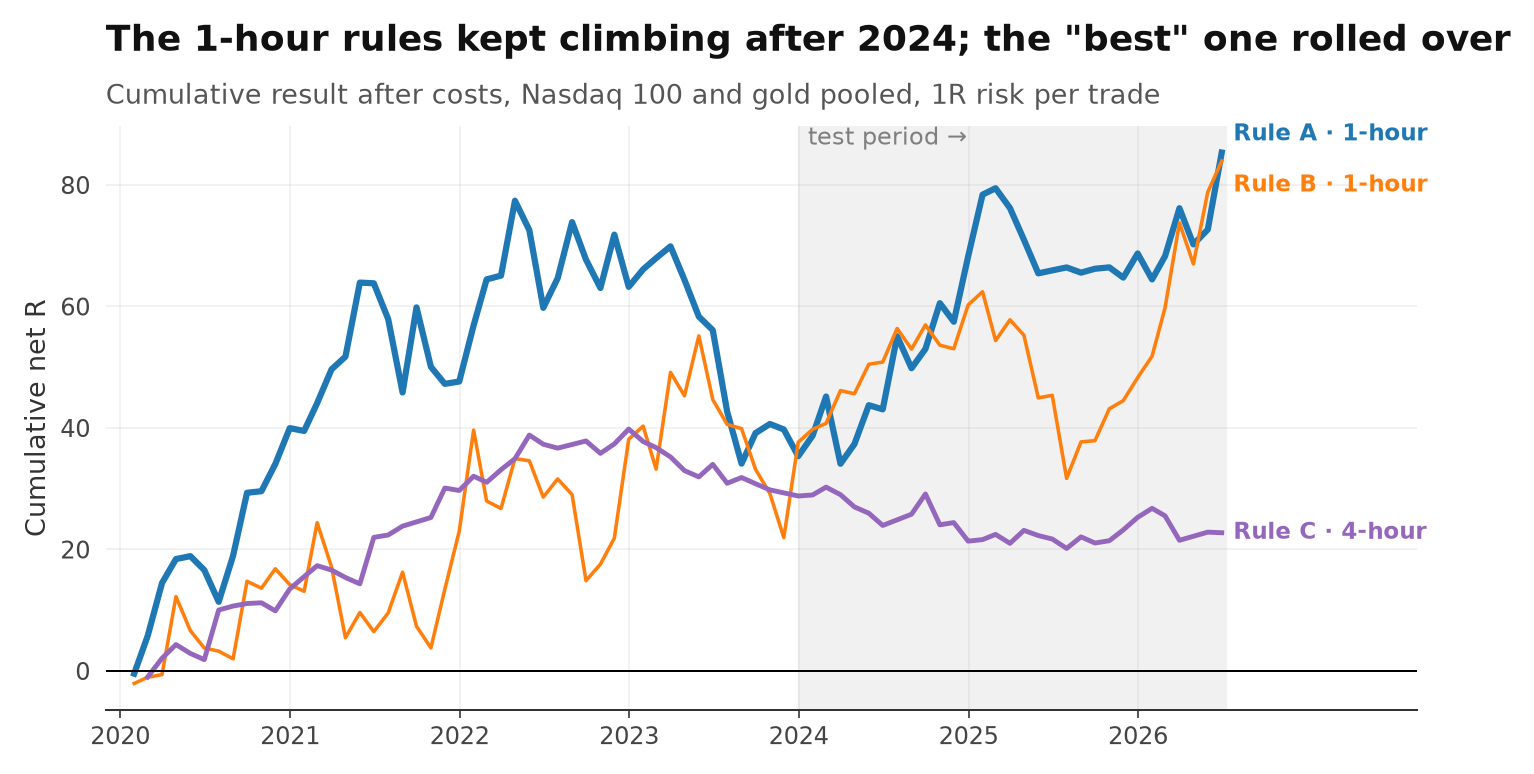
From 2024 on, it lost: -0.102R per trade on 59 trades, worse than three in four random versions. The plain Rule A on the 1-hour chart did the opposite. It earned +0.041R per trade before 2024 and +0.094R after — +50R on 534 new trades. Rule A on the 4-hour chart, the runner-up before 2024 (+0.212R), also turned negative after (-0.104R).
Rule C on the 4-hour chart is rare: 159 trades in six and a half years, only 59 after 2024. Its great early numbers rested on 100 trades — far too few to trust.
06The random test
A rule only counts if it beats random trades with the same direction, the same hour and the same stop and exit.
The Nasdaq and gold both rose strongly from 2020 to 2026. Long trades had the wind at their back, so "it made money" proves nothing.
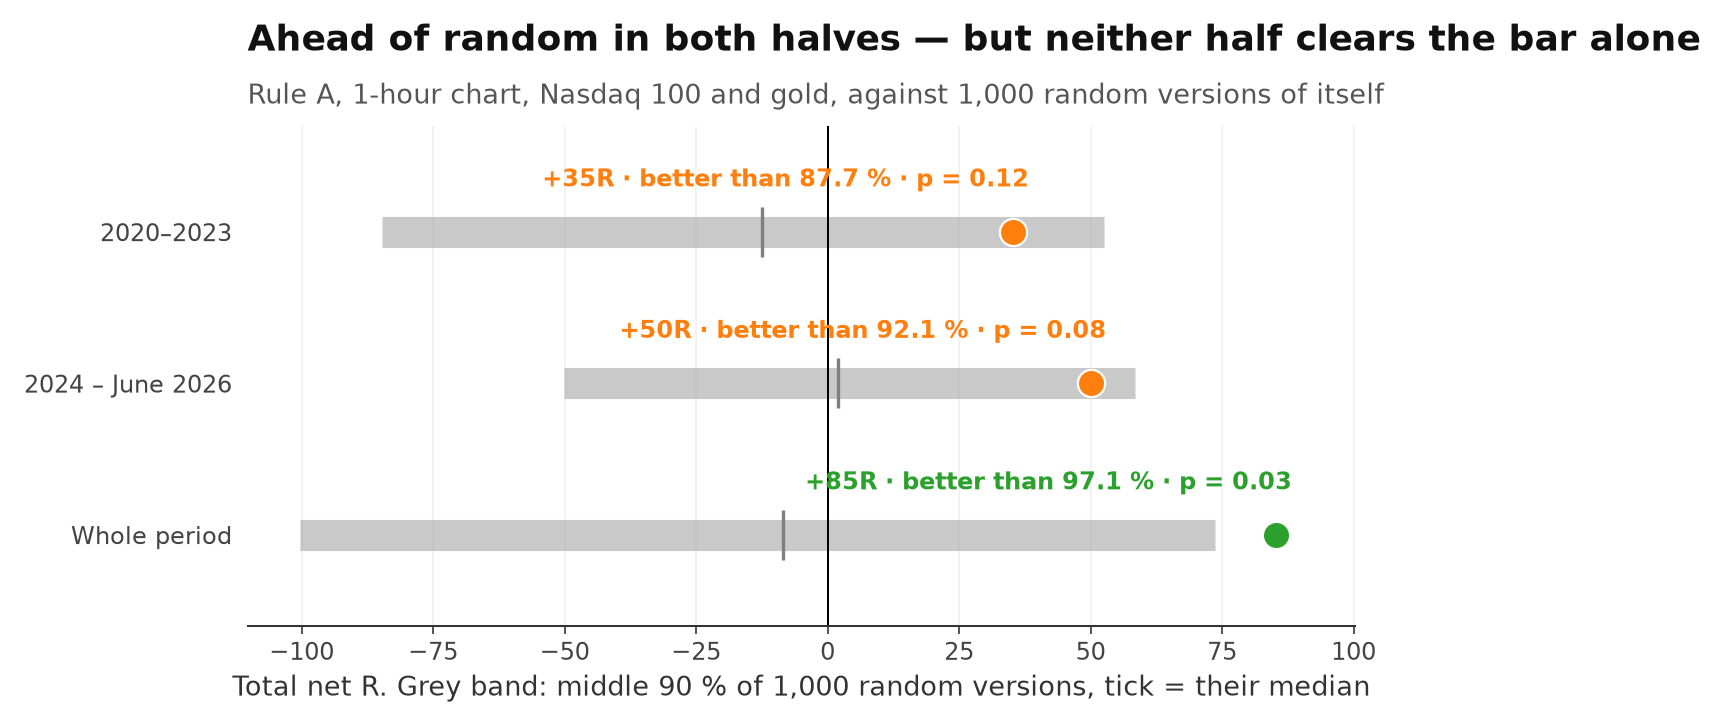
That's why every real trade got a random twin: same market, same direction, same entry hour, same 2 × ATR stop, held for the same 24 candles — but on a random weekday of the same period. We built 1,000 such random versions of the whole 1-hour Rule A system.
"Better than 95 % of random versions" means only 1 in 20 random versions did as well. The p-value is the other side of the same coin: p = 0.05 means 5 % did as well. 50 % means the rule is indistinguishable from chance.
| Rule A, 1-hour | Trades | Per trade | Random median | Beats random | p-value |
|---|---|---|---|---|---|
| 2020–2023 | 857 | +0.041R | -0.015R | 87.7 % | 0.124 |
| 2024 – June 2026 | 534 | +0.094R | +0.004R | 92.1 % | 0.080 |
| Whole period | 1,391 | +0.061R | -0.006R | 97.1 % | 0.030 |
Rule A was ahead of random in both periods — 87.7 % before 2024, 92.1 % after. That consistency is the most encouraging thing in this study. But neither half reaches the 95 % bar on its own. Only the whole period does (p = 0.030), simply because it has more trades.
07Nine variants, one trap
Test enough variants and some will look good by luck. The question is whether the good ones stay good.
| Variant | 2020–2023 | Beats random | 2024–2026 | Beats random |
|---|---|---|---|---|
| A · 15-minute | -0.068R | 62.0 % | -0.024R | 44.5 % |
| A · 1-hour | +0.041R | 87.7 % | +0.094R | 92.1 % |
| A · 4-hour | +0.212R | 98.5 % | -0.104R | 14.5 % |
| B · 15-minute | -0.077R | 54.0 % | -0.067R | 15.0 % |
| B · 1-hour | +0.032R | 91.0 % | +0.065R | 90.0 % |
| B · 4-hour | +0.060R | 81.5 % | +0.091R | 91.0 % |
| C · 15-minute | -0.127R | 8.5 % | -0.042R | 37.0 % |
| C · 1-hour | +0.049R | 80.5 % | +0.030R | 65.0 % |
| C · 4-hour | +0.288R | 97.8 % | -0.102R | 25.2 % |
4 of 9 variants made money after 2024 — all of them on the 1-hour or 4-hour chart, and all 4 had been positive before 2024 too. Not one of them beat random entries after 2024 at the 95 % level on its own.
Over the whole period, 2 of 9 variants cleared the 95 % bar: Rule A and Rule B, both on the 1-hour chart. Is that a lot? If none of the nine had any edge at all and they were independent, you would expect about 0.45 lucky hits. Two or more happen in roughly 7 % of cases by pure chance.
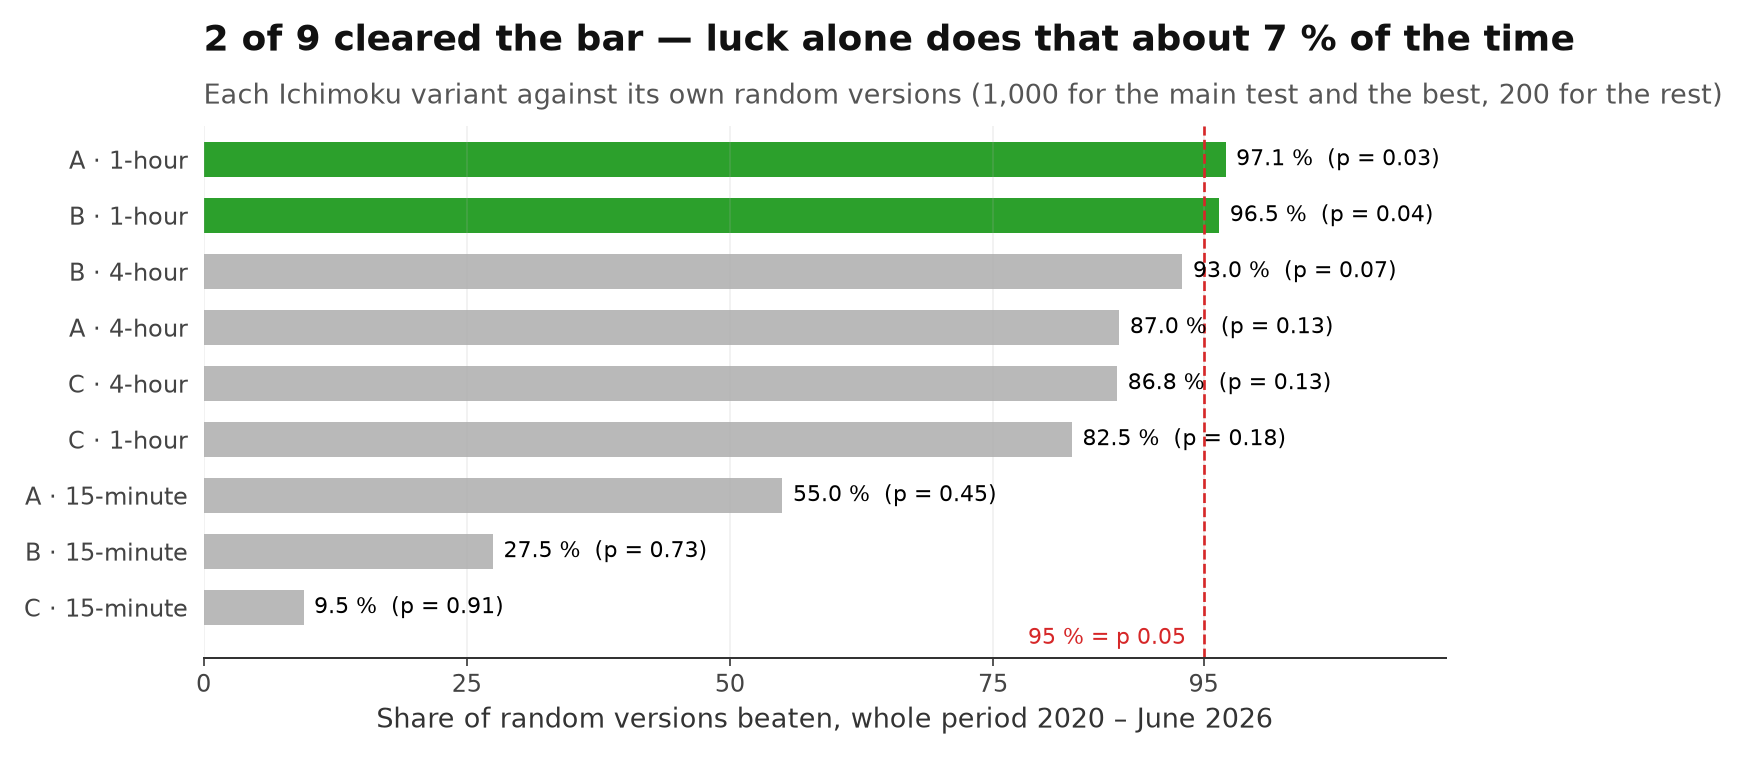
So two hits is a little more than luck usually gives — but not much. And the nine variants are not independent: Rule C is a subset of Rule A, and the 1-hour and 4-hour charts see the same trends. That makes a cluster of hits on the same chart less surprising than the 7 % suggests.
08Long, short and markets
The 1-hour rule worked on a different market in each period. That is a warning sign, not a strength.
| Rule A, 1-hour | 2020–2023 | 2024–2026 | Beats random after 2024 |
|---|---|---|---|
| Nasdaq 100 | +0.150R | +0.003R | 55.9 % |
| Gold | -0.059R | +0.177R | 97.3 % |
Before 2024, the Nasdaq carried the result and gold lost. After 2024 it flipped: the Nasdaq broke even (+0.003R), while gold made +0.177R per trade during its big rally. The pooled line looks steady, but underneath, the source of profit moved.
Long trades made +0.085R per trade, shorts +0.035R. The gap opened after 2024 (+0.159R against +0.022R), the years of the big gold rally. The random twins trade in the same direction, so the random test already accounts for this.
09Verdict
The simplest Ichimoku rule — a close through the cloud on the 1-hour chart — stayed positive on 534 trades it had never seen. It was ahead of random in both periods, but never by enough on its own to rule out luck.
The more interesting finding is what didn't work. The "confirmed" breakout with every Ichimoku condition lined up looked like the best system before 2024 and lost money after. Adding filters made the backtest prettier and the rule worse. And on the 15-minute chart, no Ichimoku rule survived costs.
If you trade the Ichimoku cloud
- Keep it simple and slow. The plain cloud cross on 1-hour charts held up best; the 15-minute chart lost on every rule.
- Expect to be stopped out often. 53.2 % of trades hit the stop. The result depends on a few large moves.
- Distrust the version that looks best. The more conditions a rule has, the fewer trades it makes — and the easier it is to fit the past.
10Limitations
- Only the default settings (9, 26, 52), one stop (2 × ATR) and one fixed exit (24 candles) were tested. Other exits, such as leaving at a Kijun cross, may behave differently.
- Two markets, both mostly rising from 2020 to 2026. Falling or sideways markets are under-represented.
- p-values are not corrected for testing nine variants. The 4-hour variants have few trades.
- 1,000 random versions for the main test and the best in-sample variant, 200 for the other seven.
- The broker's spread was partly recorded as zero in early years; then only the fixed 0.5 slippage was charged.
- Pooled results count each trade as 1R, even when both markets had a trade open at the same time. Trades can run over weekends.
The 60-second version
This study started as a Reel. Share it with someone who waits for every Ichimoku line to agree.
Next in the research library
- Do fair value gaps actually work? We tested almost 100,000 No usable edge
- Can one 5-minute candle predict the next six hours? Yes — the direction carries
- Does the double top pattern actually work? Worse than random
- Do Bollinger Bands actually predict reversals? in the lab
- Does Fibonacci actually work in trading? in the lab
- Does the weather in New York actually affect the Nasdaq? in the lab