Can one 5-minute candle predict the next six hours?
Our Session Open Momentum system trades the Nasdaq 100 off a single candle: the first one after the New York open. We tested the idea behind it in 40 variants, on data the ranking never saw and against random trades — and ran the real system through MetaTrader 5 with real ticks.
01The idea
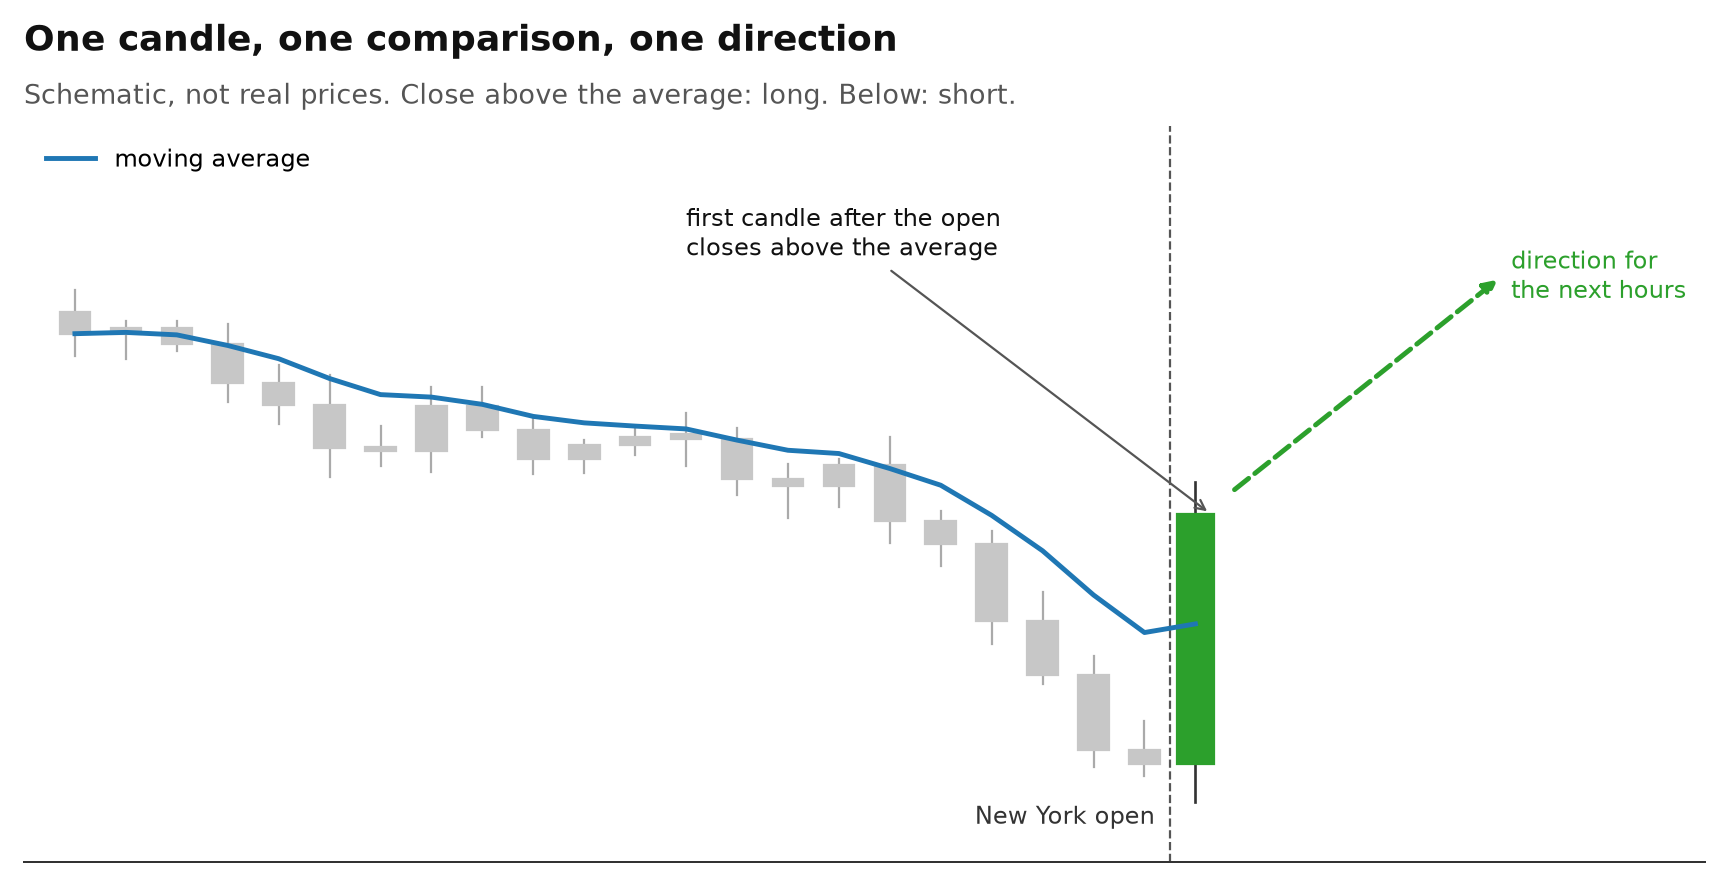
At the New York open, a flood of orders hits the Nasdaq at once. The first candle shows which side won the opening fight.
When the US stock market opens, volume jumps. Overnight news, pre-market orders and the first wave of institutional flow all land in a few minutes. The question behind Session Open Momentum is simple: does that first burst set the direction for the rest of the session?
The rule needs one candle and one line. Wait for the first 5-minute candle after the open to close. Compare its close with a short moving average. Close above the average: go long. Close below: go short. Then give the trade room — a stop far enough away that normal opening noise does not hit it — and let it run while the move continues.
One trade a day, one decision, no discretion. That is also why it is easy to fool yourself: with so few moving parts, a handful of lucky settings could look like an edge. So we did not test one version of the rule. We tested forty.
02What we tested
Not one setting, but a whole grid — ranked only on the years before 2024.
| Market | Nasdaq 100 (our broker's index CFD), five-minute prices, 2020-01-02 to 2026-06-26 |
|---|---|
| Opening candle | The first 5-minute or the first 15-minute candle after the New York open |
| Average | Exponential moving average of 10, 12, 14, 20, 21 candles |
| Holding time | 4, 6, 8, 12 hours at the most |
| Stop | The same wide, volatility-based stop and the same trailing stop in every variant |
| Trades | One per day, entry at the open of the next candle, about 1,672 per variant |
| Costs | Every trade pays the spread at entry plus 0.5 index points of slippage |
| Ranking | Only on 2020–2023. 2024 to June 2026 was only measured, never used to choose |
2 opening candles × 5 averages × 4 holding times = 40 variants, 66,830 trades in total. We measure in R: the distance to the stop is 1R, so +0.05R per trade means you win on average a twentieth of what you risk.
The grid is a research tool: a simple, fixed version of the idea, moved around in every direction to see whether it depends on lucky numbers. Session Open Momentum has its own exact rules, which this page does not spell out.
03Results: all 40 variants
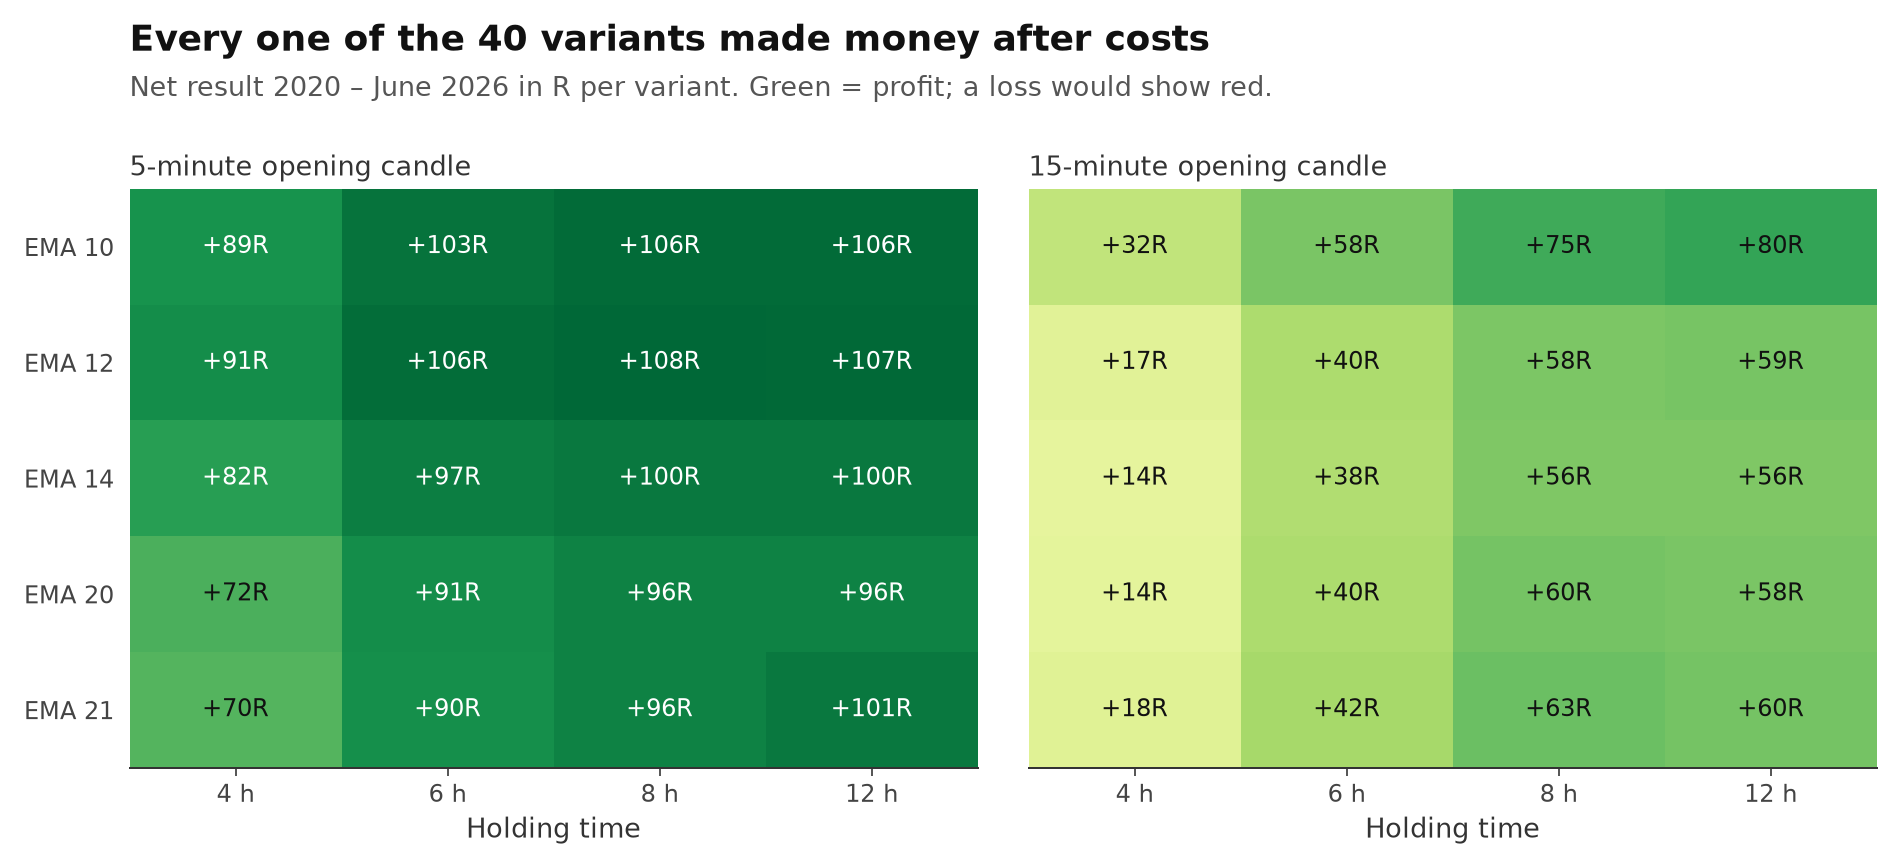
Every one of the 40 variants made money after costs. The weakest still finished positive.
| 40 variants, after costs | Lowest | Median | Highest |
|---|---|---|---|
| Net result | +14R | +74R | +108R |
| Per trade | +0.008R | +0.044R | +0.065R |
| Profit factor | 1.03 | 1.15 | 1.19 |
| Win rate | 49.7 % | 51.1 % | 52.3 % |
| Worst drawdown | 18R | 27R | 49R |
Two patterns stand out. The 5-minute candle beat the 15-minute candle in every combination — on average +0.057R against +0.028R per trade. The first few minutes seem to carry the information; wait longer and part of the move is already gone. And longer holding times did better than four hours (more in section 6).
The win rate is close to a coin flip in every variant. The profit comes from the size of the winners, not from how often the rule is right. Costs took 26 % of the profit before costs.
04Data the ranking never saw
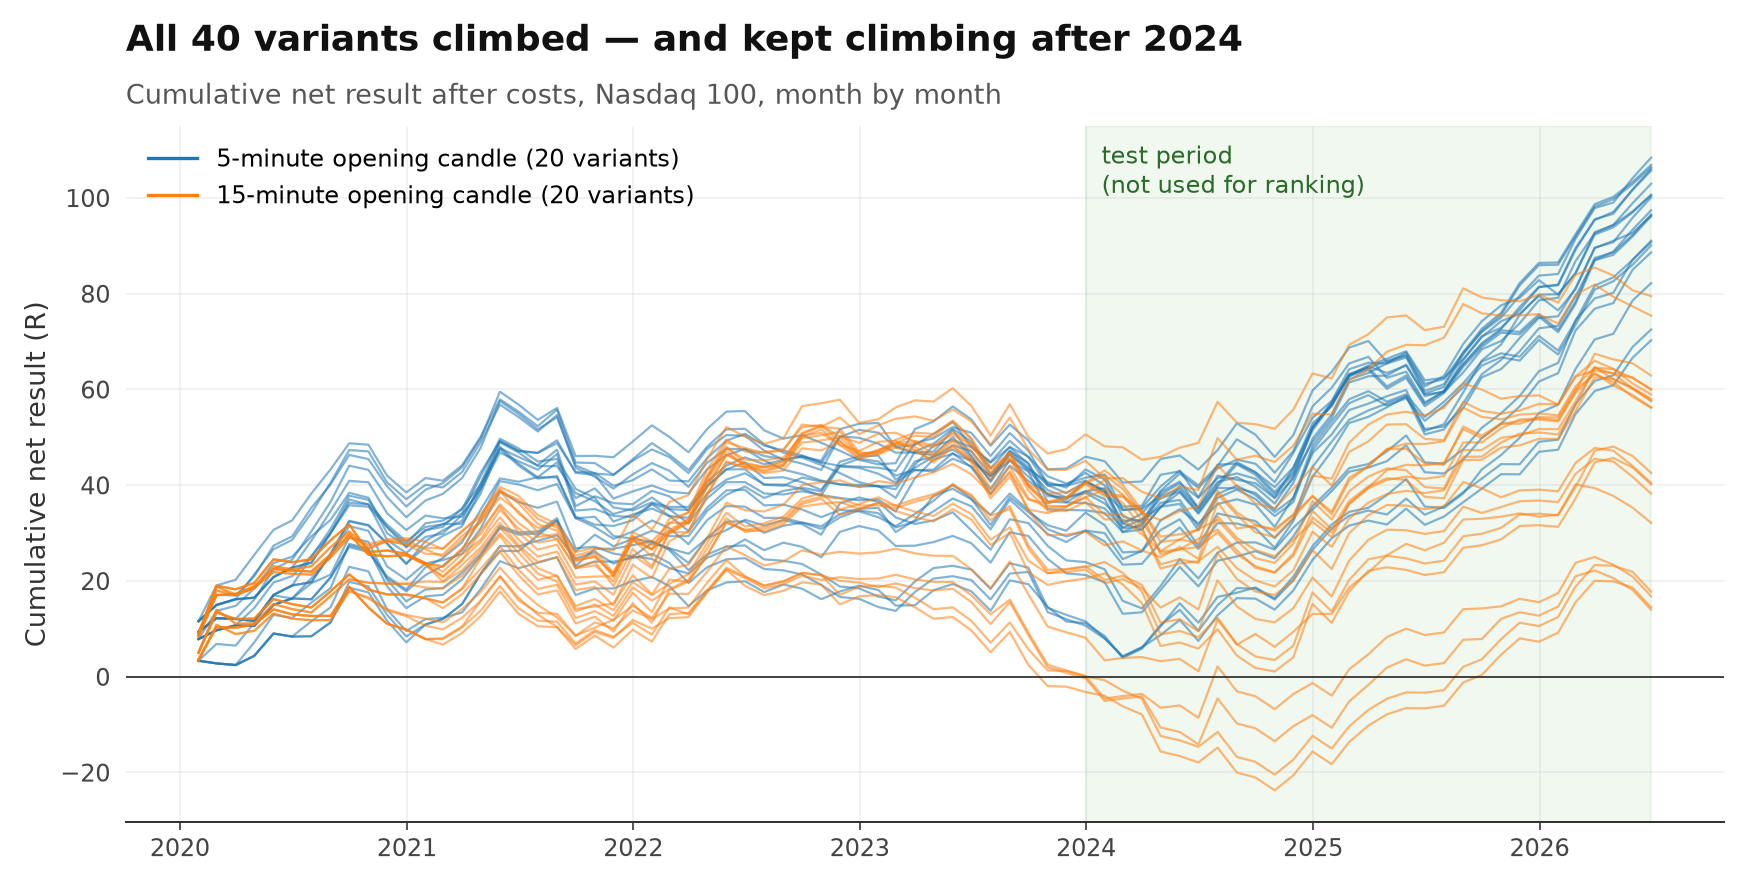
All 40 variants stayed profitable after 2024. 31 of them did even better than before.
A rule fitted to the past usually fades on new data. So the variants were ranked on 2020–2023 only, and 2024 to June 2026 was kept back as a test. In the ranking years, 37 of 40 variants were profitable — the three that were not were all 15-minute variants with a 4-hour exit, and close to zero. In the test years, all 40 were.
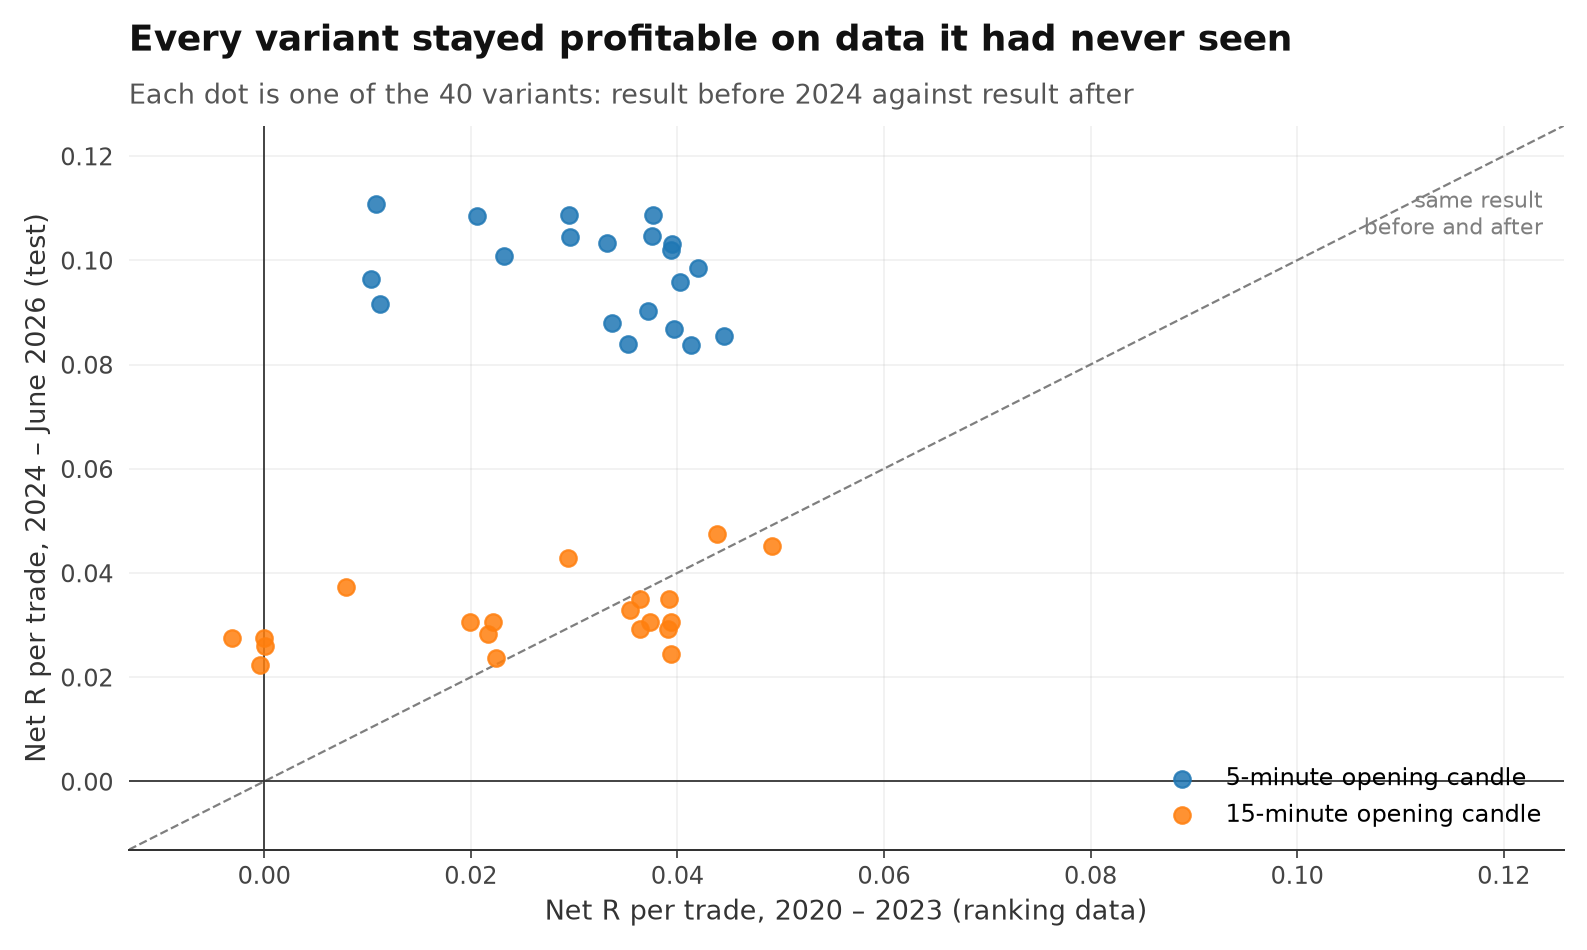
Per trade, the variants made between +0.022R and +0.111R in the test period. The 5-minute variants averaged +0.098R there, up from +0.032R before — the Nasdaq's strong trends in 2024–2026 may simply have suited the idea.
One honest detail: the ranking before 2024 said little about the ranking after. The rank correlation was only 0.21. So the "best" setting of the past was not the best setting of the future — but all ten best-ranked variants still made money after 2024. What carried was the idea, not one precise number.
05The random test
Trading at random after the open earned nothing. The 5-minute candle did far better — the 15-minute candle only a little.
"It made money" is not enough. The Nasdaq rose over most of these years, and long-biased rules look good in a rising market. So every variant was compared with random copies of itself: the same number of trades, entered on a random five-minute candle in the first three hours after the open, in a random direction, with the same stop, exits and costs.
p = 0.05 means 1 in 20 random copies did as well as the rule. The lower, the less likely it is luck. Most variants were compared with 200 random copies, three with 1,000.
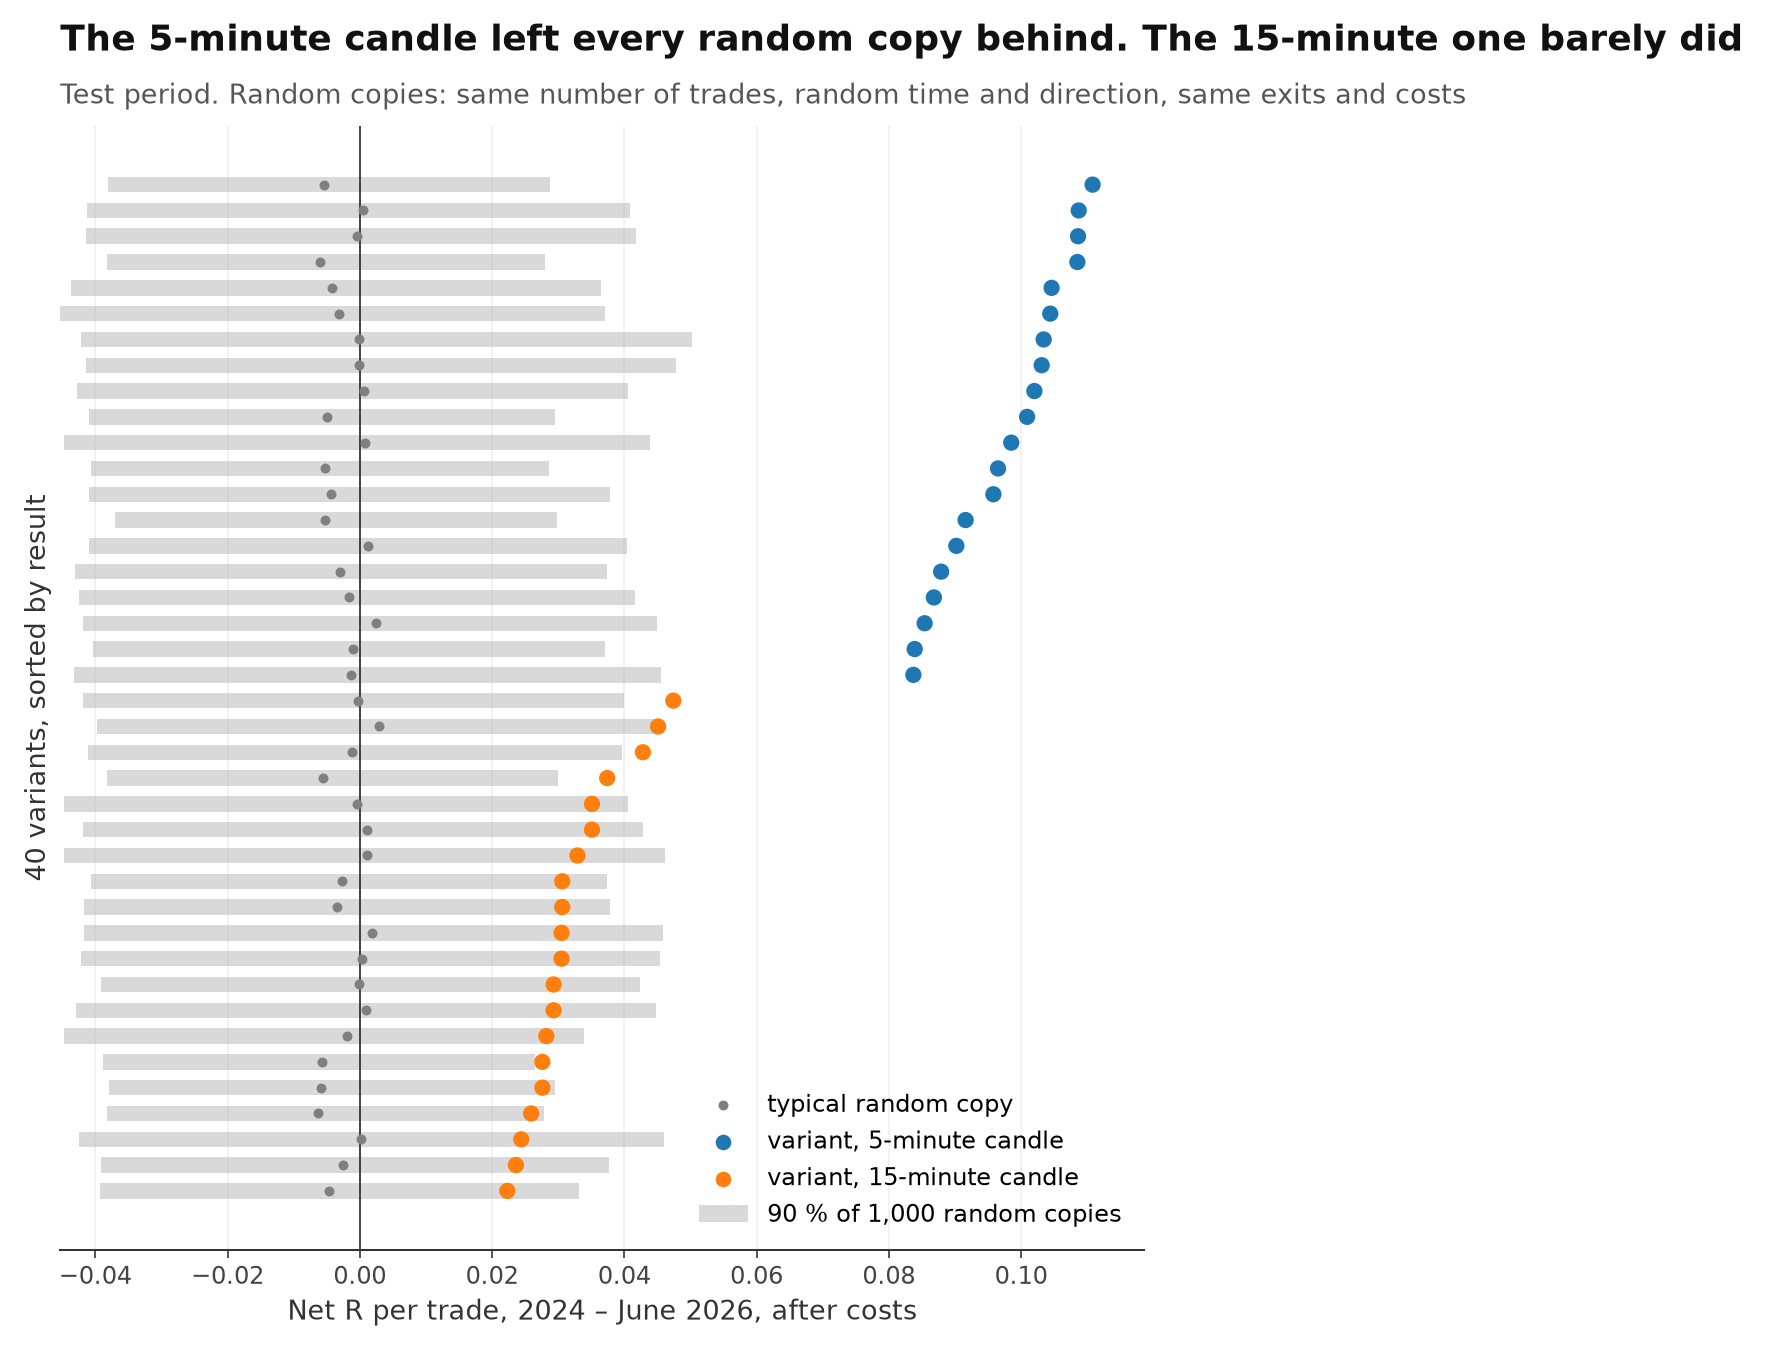
In the test period, the typical random copy made between −0.011R and +0.007R per trade — nothing. All 20 variants with a 5-minute candle beat random clearly (p at or below 0.05, down to 0.001). With a 15-minute candle, only 3 of 20 did; the rest were positive but within reach of luck (p up to 0.19).
Over the full period, 36 of 40 variants beat random at p below 0.05. That is the clearest result of this study: the very first five minutes after the open carry information about the next hours. Waiting for a 15-minute candle throws much of it away.
06How long the direction lasts
Four hours was the weakest holding time. The direction kept paying for longer.
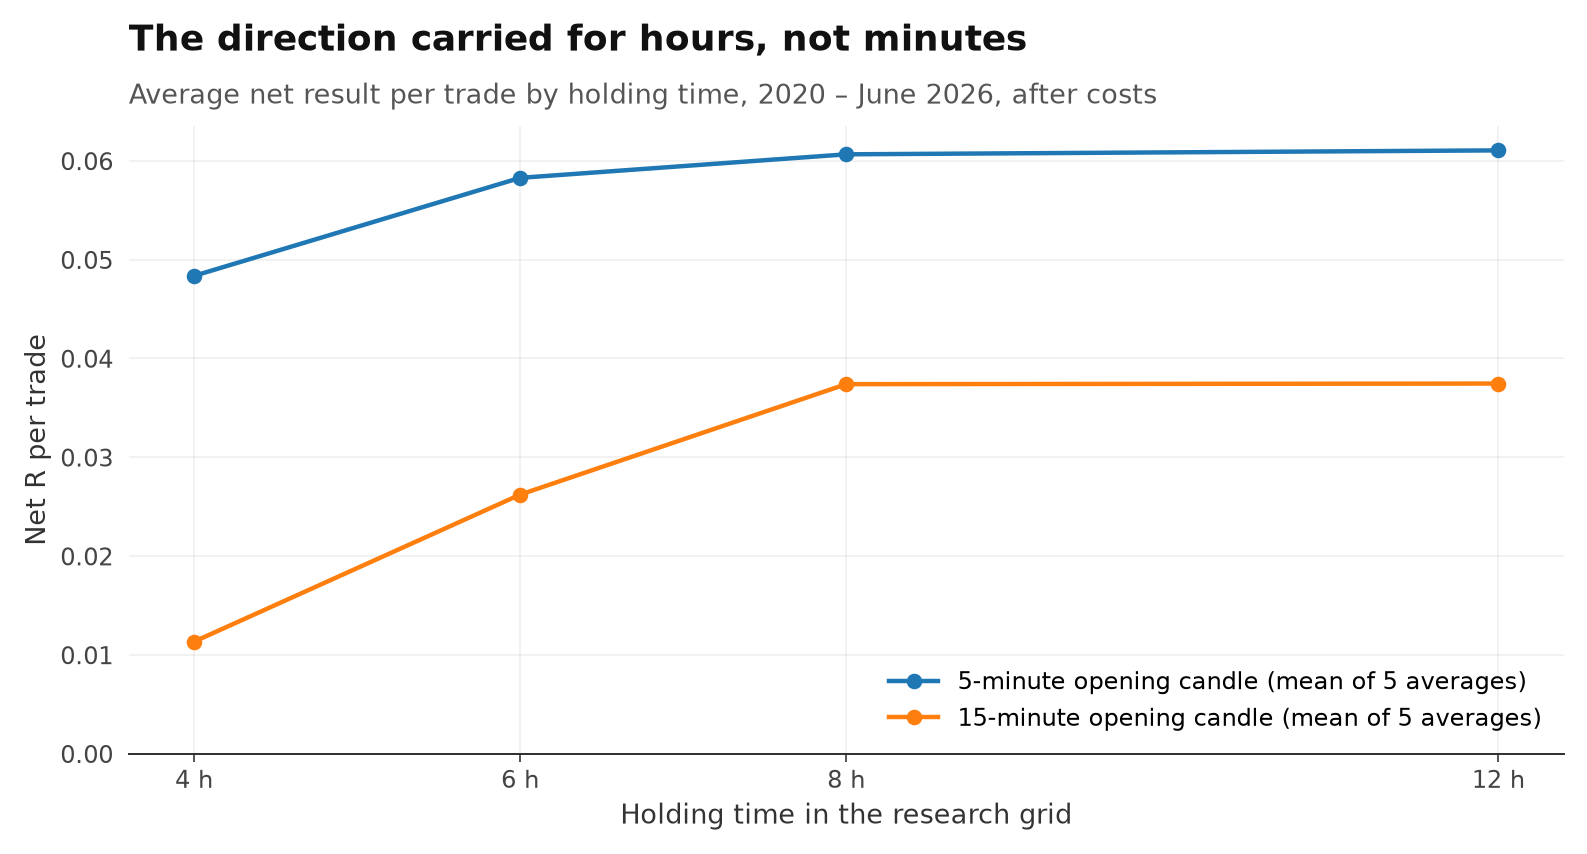
With a 5-minute candle, the average variant made +0.048R per trade when the trade was closed after four hours at the latest, and +0.058R after six. Beyond that, it barely changed. In other words: the direction set by the first candle was still paying six hours later — and gave little back after that. That answers the question in the title.
This is also why the stop has to be wide. A trade that is meant to ride a move for hours cannot be stopped out by the normal back-and-forth of the first half hour.
07The real system in MetaTrader 5
The grid tests the idea. MetaTrader 5 tests the system — with real ticks, real spreads and real position sizing.
Session Open Momentum turns the idea into a complete system: its own choice of average, its own stop and trailing rules, and position sizing at 1 % of the account per trade. This is its official backtest in the MetaTrader 5 strategy tester, 2019-01-01 to 2026-09-28, on real tick data (99% history quality), starting with 10,000 USD.
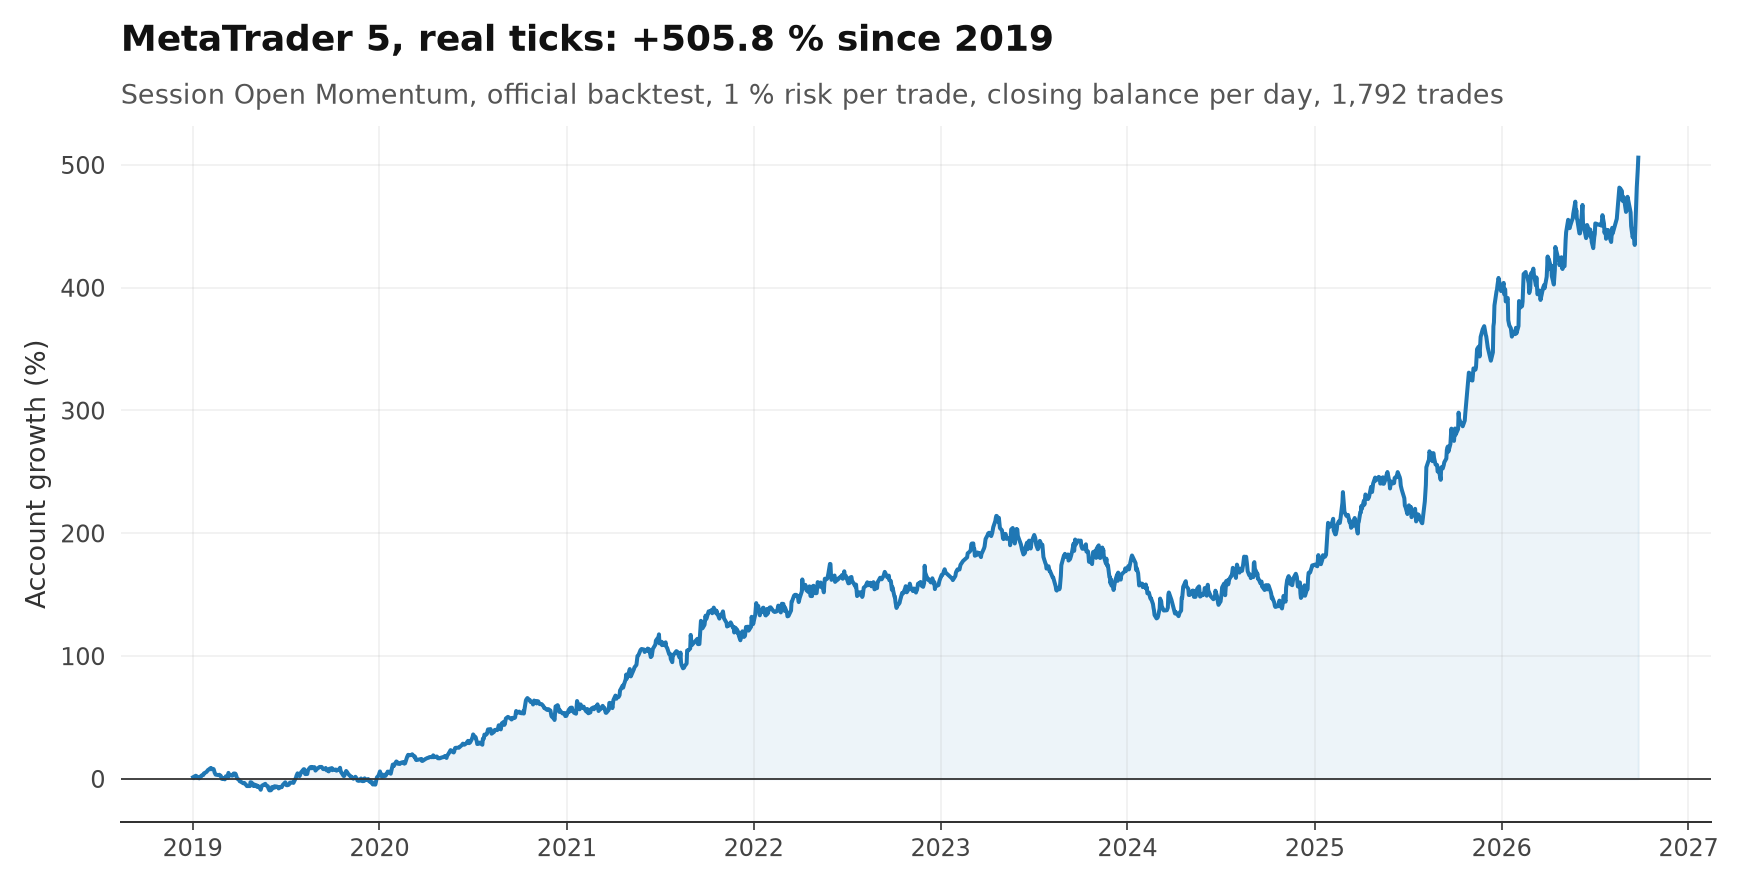
| MetaTrader 5, 2019 – 2026 | Result |
|---|---|
| Net return | +505.8 % |
| Trades | 1,792 (about 232 per year) |
| Win rate | 56.4 % |
| Profit factor | 1.24 |
| Worst drawdown (closed trades) | 26.6 % |
| Worst drawdown (incl. open trades) | 28.5 % |
| Profitable months | 65 % of 93 |
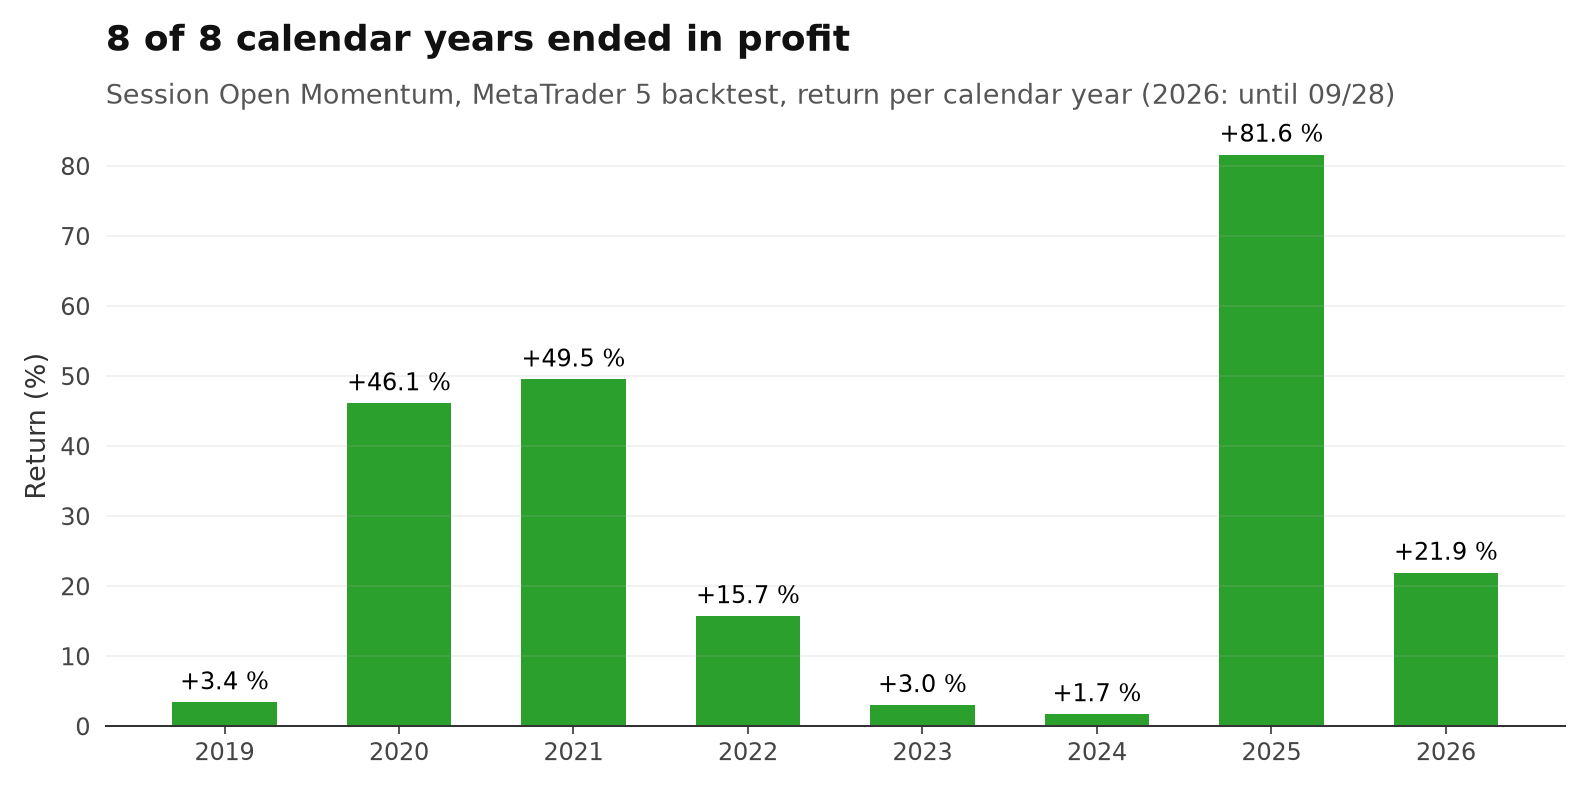
Every calendar year ended in profit — but not evenly. +3.0 % in 2023 and +1.7 % in 2024 were close to flat, +81.6 % in 2025 was the best year. A drawdown of 26.6 % at 1 % risk per trade means long stretches where the account goes nowhere or down. That is the price of a strategy that wins only a little more than half of its trades.
The grid above was ranked before 2024 and tested after. The system's MetaTrader 5 run is not split that way: it covers all years at once, with no period kept back. It shows what the complete system did, with realistic execution — not how it will do in the future.
08What we don't show
The idea is public. The exact rules of the system stay with the system.
Every other study in this library publishes the full rules. This one doesn't, because Session Open Momentum is a system our customers pay for. You will not find its exact average, the width of its stop, when and how its stop trails, its trading hours and exits, its filters or its position sizing on this page — and we don't say which cell of the grid comes closest to it.
What we do show is the evidence that matters: the idea works across a whole grid of settings, on years the ranking never saw, and better than random trades — and the system itself, run tick by tick in MetaTrader 5.
09Verdict
On the Nasdaq 100, the close of the first 5-minute candle after the New York open, compared with a short moving average, gave the direction for the following hours. All 40 variants were profitable after costs, all 40 after 2024, and every 5-minute variant beat random trades.
So can one 5-minute candle predict the next six hours? Not every day — almost half of all trades lose. But on average, and after costs, the direction of that one candle was still paying six hours later. The edge per trade is small (+0.044R in the median variant), so it only works with discipline: one trade a day, a wide stop, no early exits out of nerves, and the patience to sit through flat years.
The 15-minute candle is the weak spot. It was profitable too, but most of its variants did not clearly beat random after 2024. If the idea has an edge, it lives in the first five minutes.
10Limitations
- One market (the Nasdaq 100) and one broker's CFD prices. We did not test other indices in this study.
- Only one test period (2024 – June 2026), in which the Nasdaq trended strongly. Choppy years are weaker: 2023 and 2024 were close to flat for the system.
- 40 variants on the same data: multiple testing is not built into the p-values. The grid shows a broad plateau, not one tuned number, which limits that risk but does not remove it.
- Five-minute candles in the grid, no tick data. When a stop and an exit fall in the same candle, the stop is counted.
- A first candle shorter than five minutes could not be tested: we have no one-minute history for this market.
- The MetaTrader 5 backtest is not out-of-sample, and backtests do not include every live effect (slippage spikes, outages, requotes).
The 60-second version
This study started as a Reel. Two more Reels cover the same idea: "Can one five minute candle predict the next six hours?" and a third take. The full test is above.
Next in the research library
- Do fair value gaps actually work? We tested almost 100,000 No usable edge
- Does the double top pattern actually work? Worse than random
- Does the Ichimoku cloud actually give you an edge? A faint edge, not proven
- Do Bollinger Bands actually predict reversals? in the lab
- Does Fibonacci actually work in trading? in the lab
- Does the weather in New York actually affect the Nasdaq? in the lab