Does the point of control actually pull price back?
We built yesterday's volume profile for 1,616 Nasdaq sessions, checked how often price came back to the point of control, and traded the return to it on 1,096 days — always against a random comparison.
01What the point of control is
A volume profile shows how much traded at each price. The point of control (POC) is the price where the most traded.
A normal chart shows volume over time. A volume profile turns it sideways: it shows volume per price.
- POC — the single price level with the most volume
- Value area — the price zone around the POC that holds 70 % of the volume
- VAH / VAL — the top and bottom of the value area
The popular idea: the POC is the "fair" price, so the next day price is drawn back to it like a magnet.
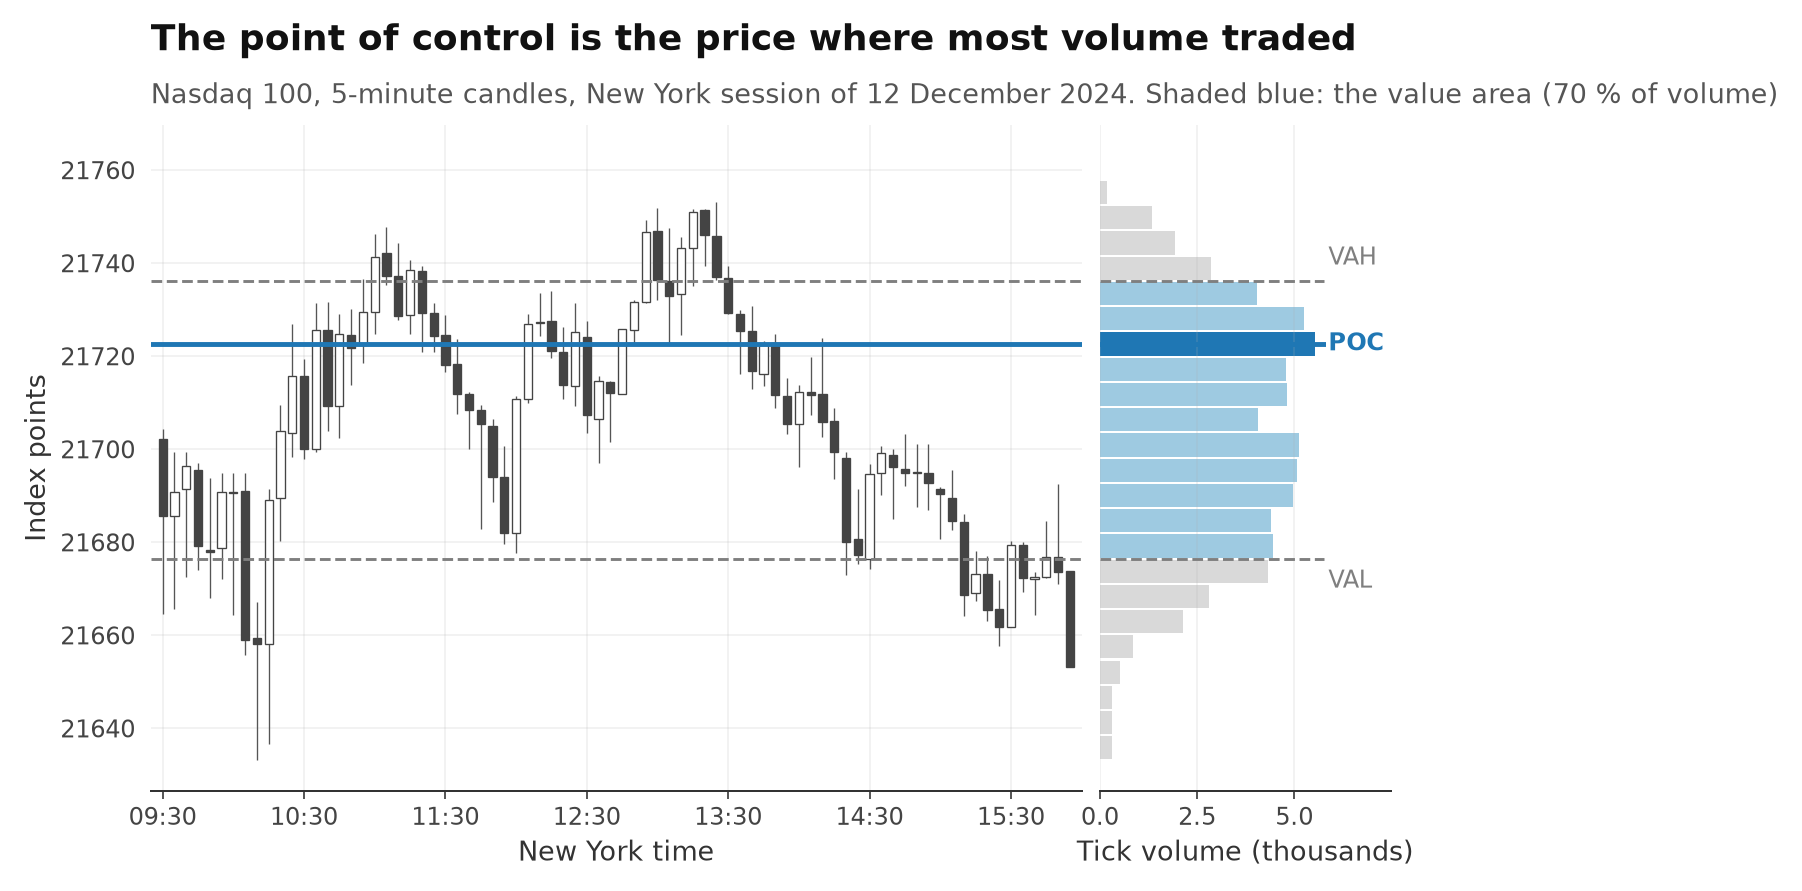
How we built it: every 5-minute candle's volume is spread evenly over its high-to-low range, in price steps of 0.025 % (about 5 Nasdaq points). The value area grows from the POC towards whichever side has more volume, until it holds 70 %.
02What we tested
Two questions: does price come back to yesterday's POC more often than chance — and can you trade that?
Everything is based on the New York cash session, 9:30–16:00 New York time, on the Nasdaq 100 (5-minute candles, January 2020 – June 2026). Each session's profile is compared with the next session. That gives 1,616 pairs of sessions.
Question 1 — the magnet: in how many sessions did price touch yesterday's POC at least once?
Question 2 — the trade: when the session opens outside yesterday's value area, does a trade back to the POC make money?
03Is the POC a magnet?
Price touched yesterday's POC in 55.2 % of sessions. A random price at the same distance: 52.6 %.
"Price came back to the POC" sounds impressive. But the POC is often close to where the next day opens — and nearby prices get touched a lot anyway.
So for every session we also placed a random level at exactly the same distance from the open, randomly above or below it. We did that 1,000 times. If the POC is a real magnet, it should beat those random levels.
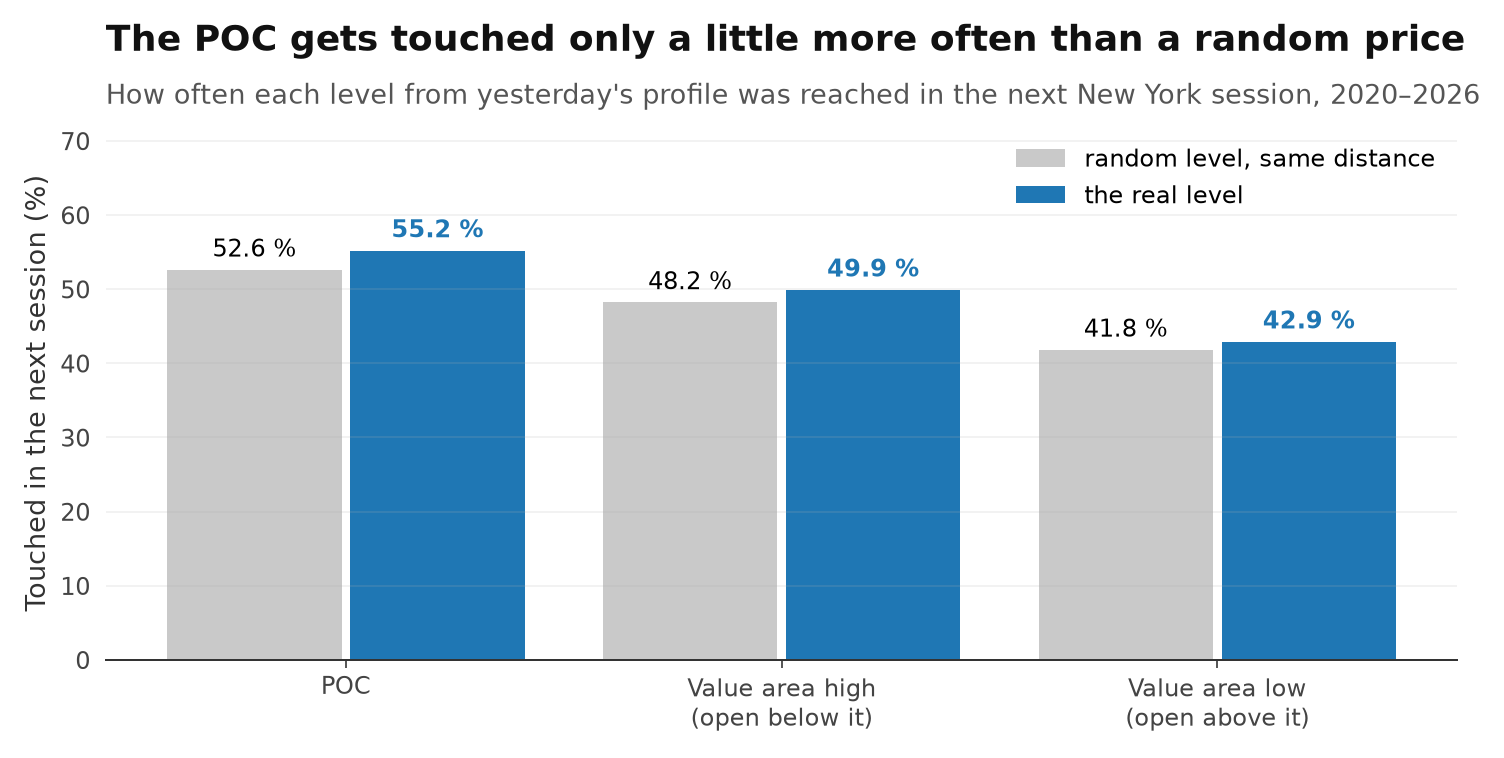
The POC wins by 2.6 percentage points. That's about 3 extra touches per 100 sessions. The value area edges do even less: neither beats chance (VAH p = 0.1459, VAL p = 0.3227).
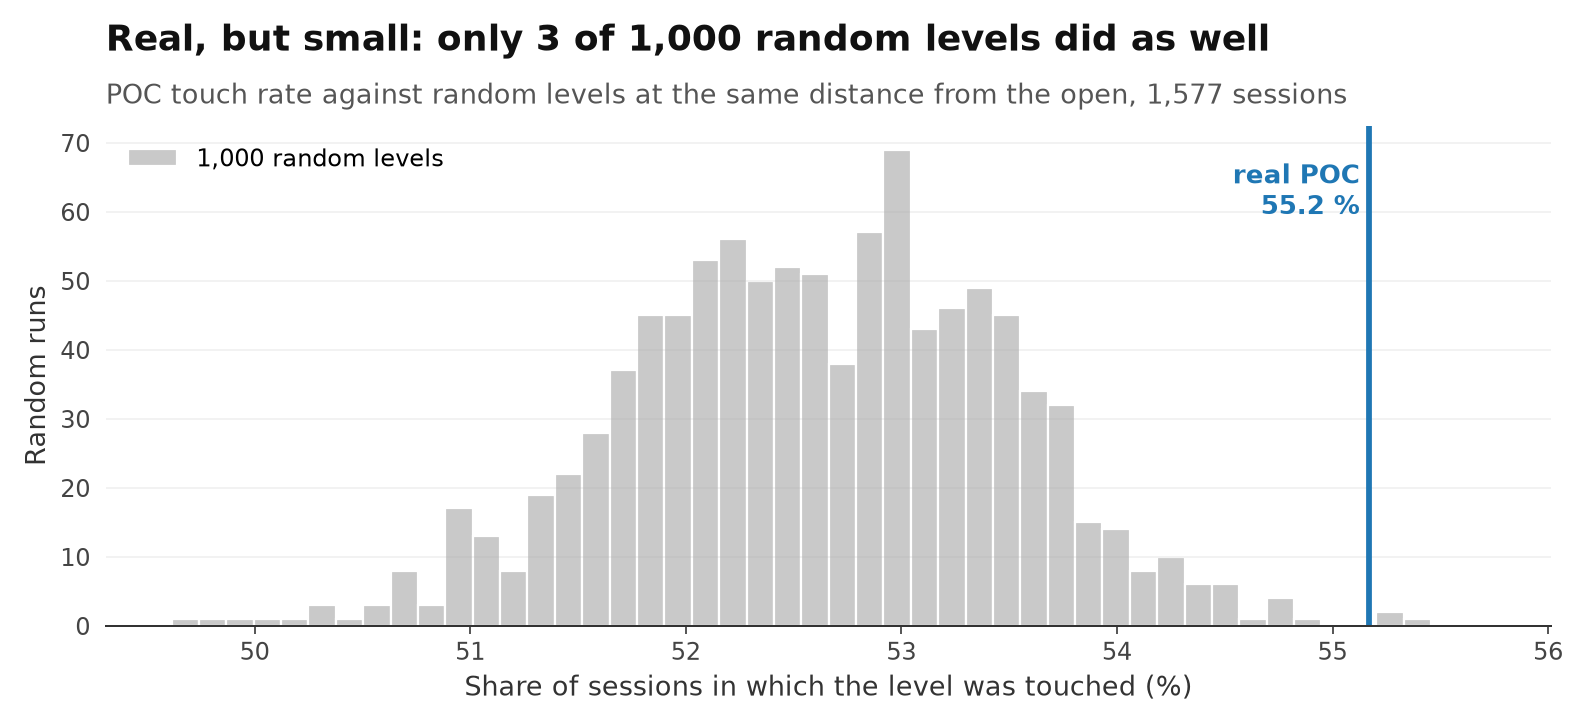
Small, but not luck: only 3 of 1,000 random runs did as well (two-sided p = 0.007). It was also stable: 55.1 % in 2020–2023 and 55.2 % in 2024–2026.
Where the pull comes from
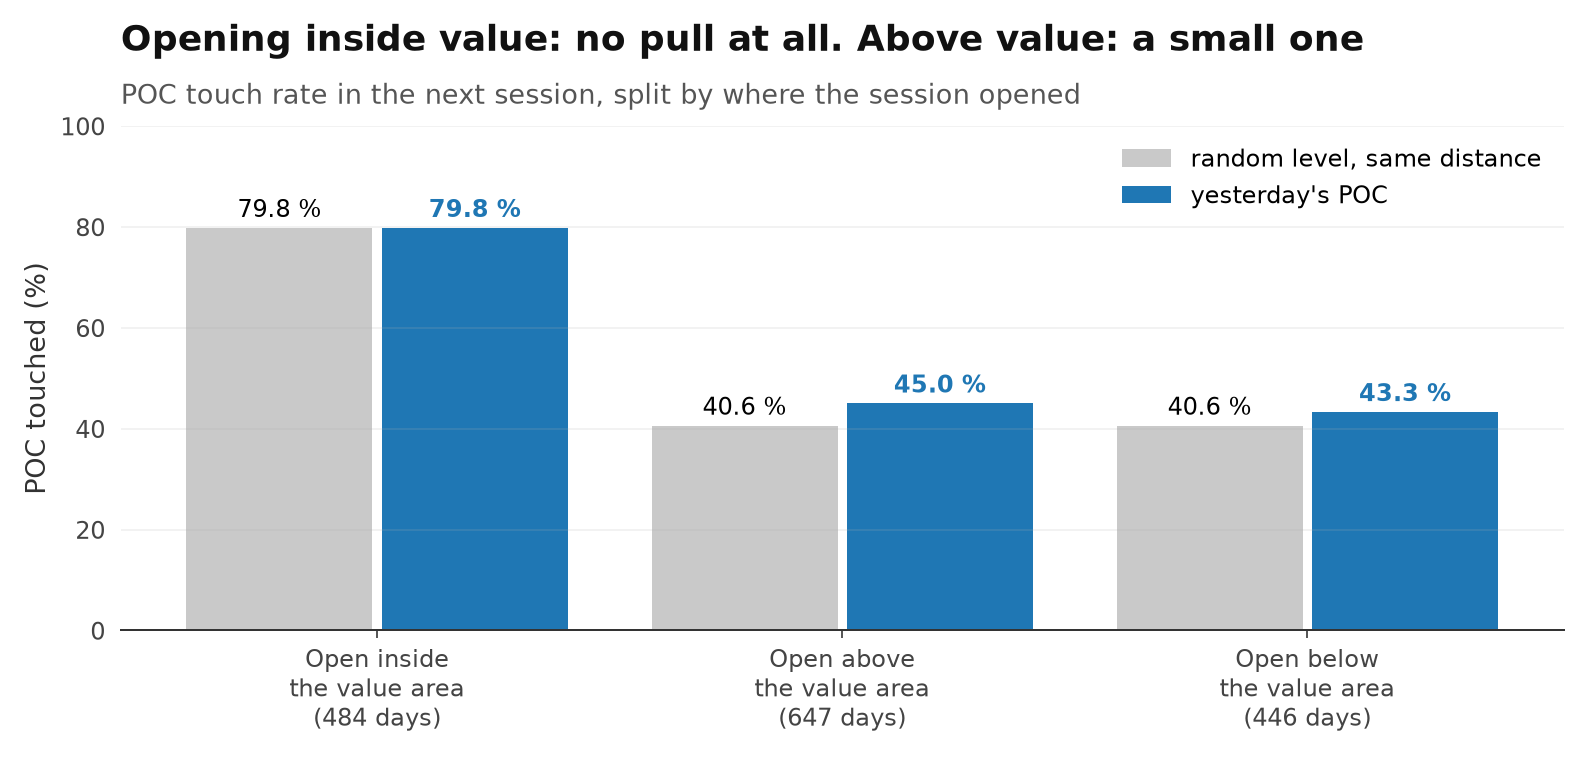
- Open inside the value area (484 days): 79.8 % vs. 79.8 %. No effect at all.
- Open above it (647 days): 45.0 % vs. 40.6 %, p = 0.004. The clearest effect.
- Open below it (446 days): 43.3 % vs. 40.6 %, p = 0.1409. Not distinguishable from chance.
That's exactly the situation the classic trade targets. So let's trade it.
04How a trade is counted
If the first 5-minute candle closes outside yesterday's value area, trade back towards the POC. The POC is the target.
| Signal | The first candle of the session (9:30–9:35 New York) closes above the value area high or below the value area low |
|---|---|
| Entry | Open of the next candle, towards the POC — short above value, long below. Only if price is still outside the value area and at least 0.1 % away from the POC |
| Target | Yesterday's POC |
| Stop | On the other side, 1 × the distance to the POC (base version). This distance is 1R — our unit of risk |
| Time exit | End of the session (16:00 New York) |
| Worst case | If stop and target are hit in the same candle, we count the stop. A gap through the stop fills at the open |
| Positions | At most one trade per session |
Two real trades from the test:
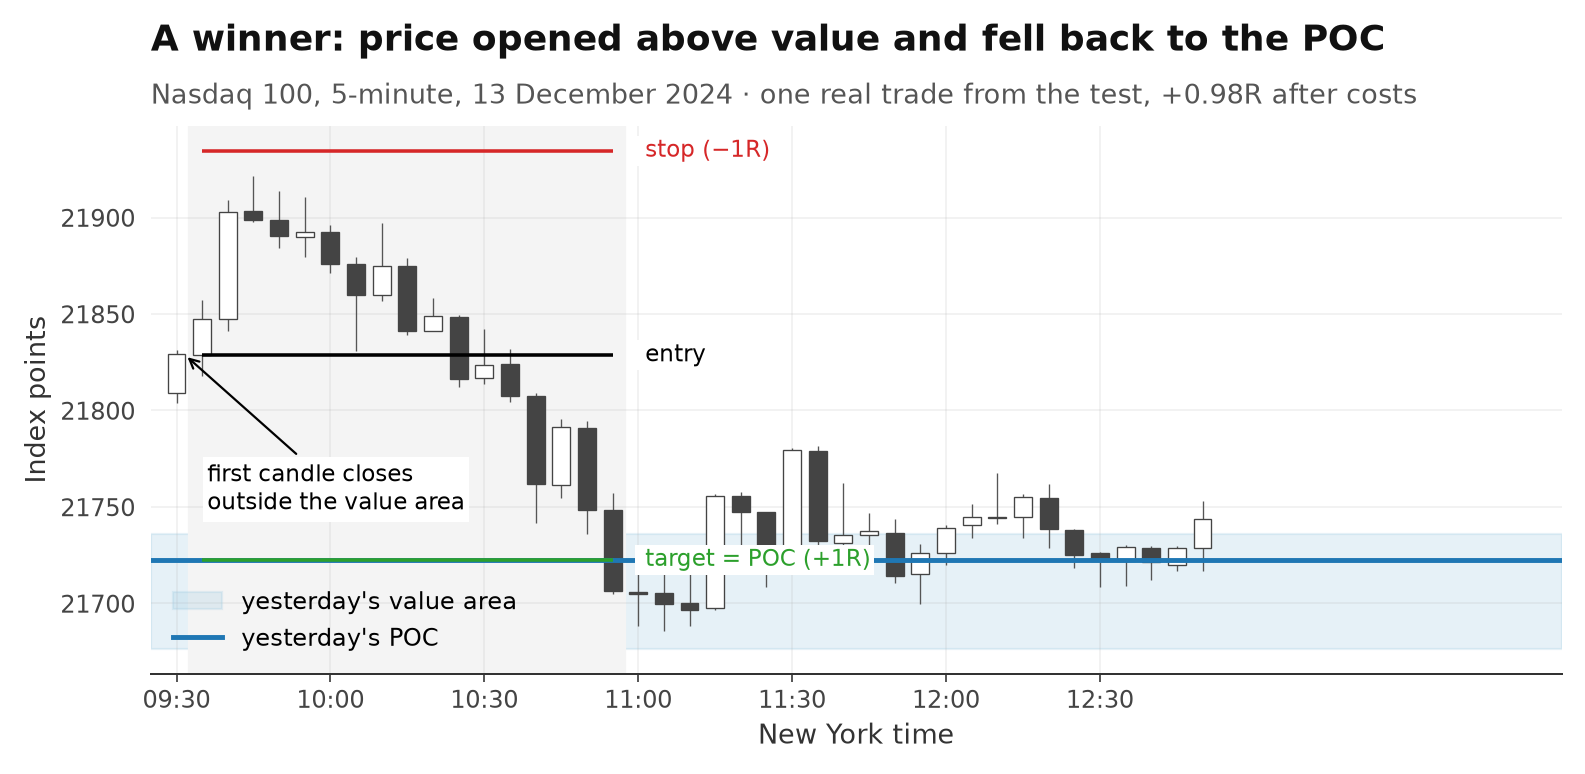
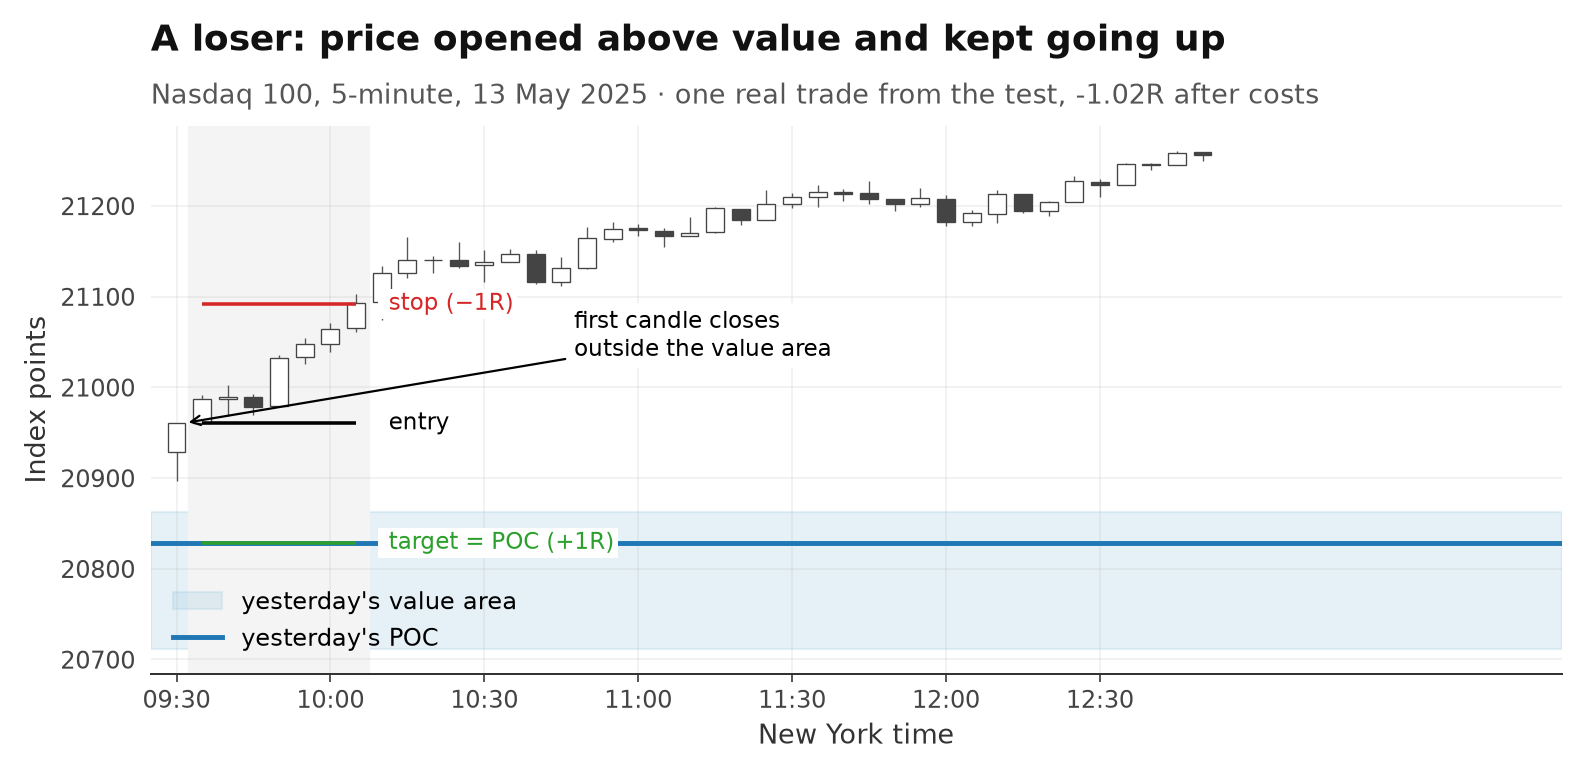
These two are picked so the mechanics are easy to see. Overall, 50.6 % of base trades were winners.
05Costs
Costs are small per trade here — but so is the edge.
Every trade pays the real spread at entry plus 0.5 points slippage: about 2.0 Nasdaq points. The typical distance to the POC was 121 points, so costs ate about 1.6 % of the risk on a median trade (average 2.1 %).
That matters, because the edge is tiny. Before costs the base rule made +0.031R per trade. After costs, +0.009R. Costs took about 70 % of it.
Risking $100 on every trade, you'd have made about $0.93 per trade on average — and $1,020 over 1,096 trades in six and a half years.
06Build first, judge later
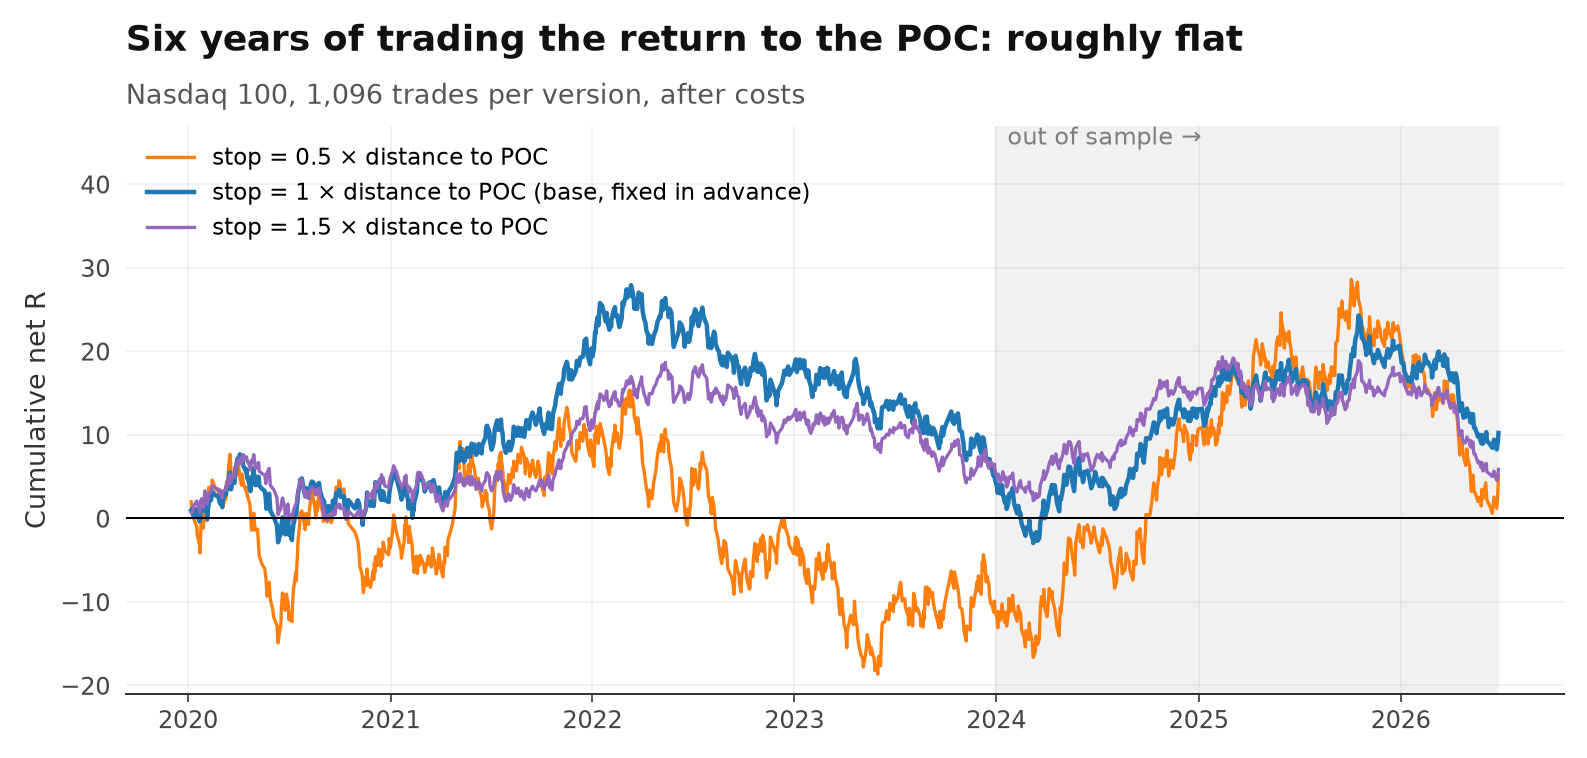
The base stop was fixed in advance. Choosing the stop with hindsight would have made things worse, not better.
We tested three stop sizes: 0.5, 1.0, 1.5 × the distance to the POC. The base version (1 ×) was set before looking at any results.
As a check, we also let the data choose — but only from 2020–2023. Then we looked at 2024 – June 2026, which played no part in the choice.
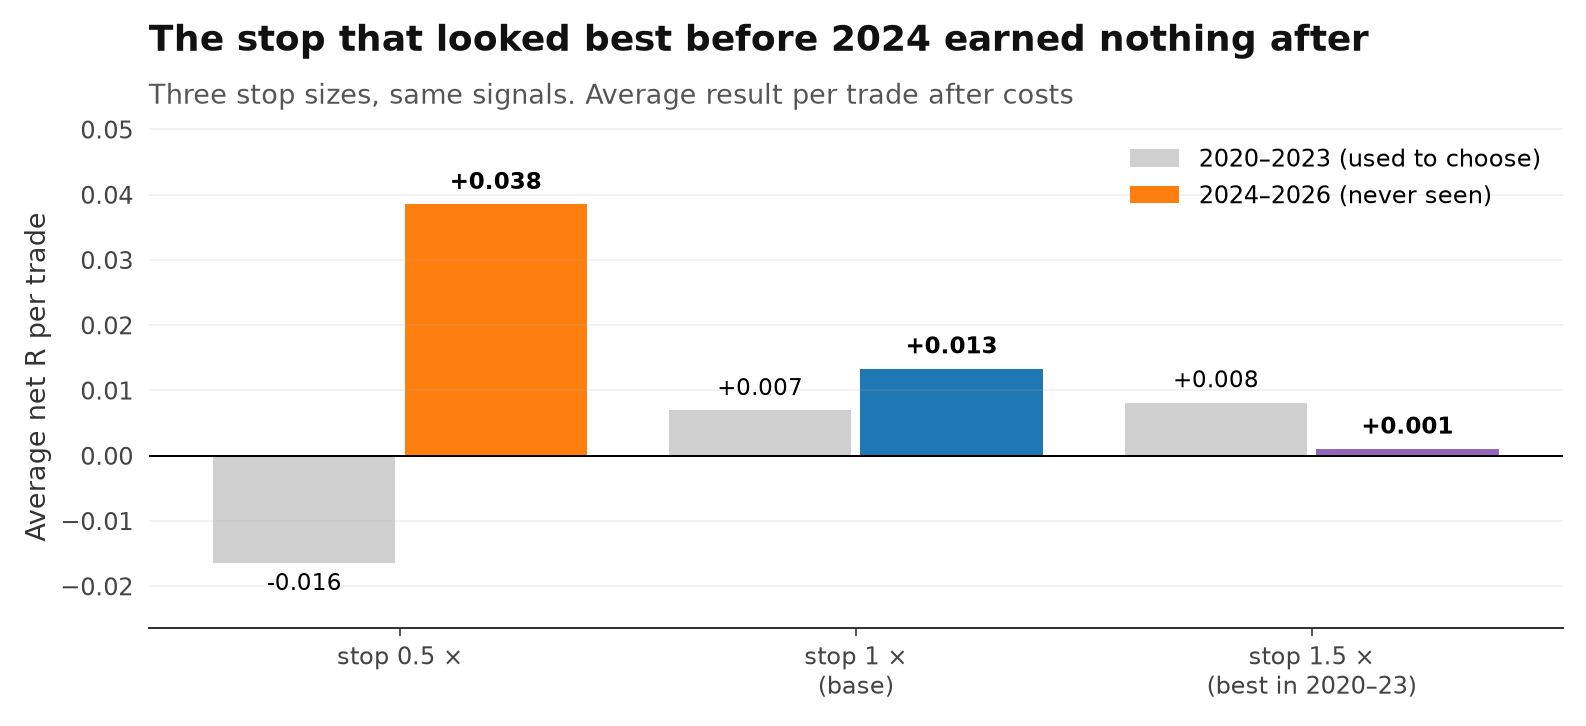
The stop that looked best before 2024 (1.5 ×) made +0.001R per trade afterwards. The one that looked worst (0.5 ×) became the best. When rankings flip like that, the differences are mostly noise.
07The trade against random entries
The rule beat random entries — but only by a hair, with p = 0.0519.
A profit alone proves nothing. So the base rule was compared with 1,000 random versions of itself: the same number of trades, the same stop and target distances, the same costs — but entries at random candles of random sessions, in a random direction.
p = 0.05 means 1 in 20 random versions did as well as the rule. The lower, the less likely it's luck.
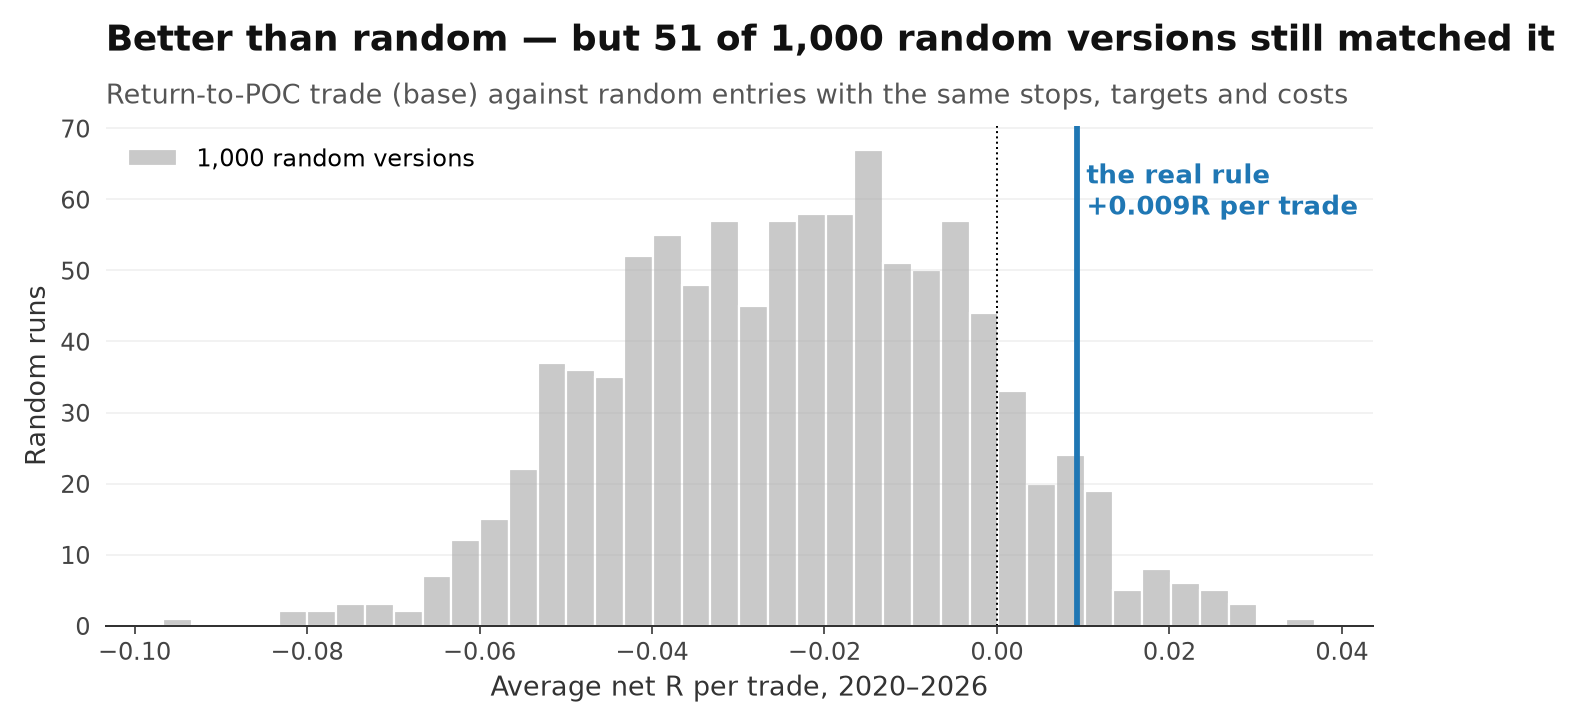
51 of 1,000 random versions did at least as well. That puts p at 0.0519 — right on the edge of the usual 5 % bar, and we tested three stop sizes, not one. The other two came out at p = 0.0896 (0.5 ×, 200 random runs) and p = 0.0689 (1.5 ×).
08Over time
Six and a half years of trading for +10.2R — with a drawdown of 30.9R along the way.
| Base rule (1 × stop) | Trades | Win rate | Per trade | Total |
|---|---|---|---|---|
| 2020–2023 | 675 | 50.4 % | +0.007R | +4.6R |
| 2024–2026 | 421 | 51.1 % | +0.013R | +5.6R |
| Shorts (open above value) | 658 | 49.5 % | +0.019R | +12.6R |
| Longs (open below value) | 438 | 52.3 % | -0.005R | -2.3R |
The 2024–2026 period held up (+0.013R per trade). But look at the curve: the rule spent most of 2022 and 2023 giving back what it had made, and the worst drawdown (30.9R) is about 3 times the final profit.
All the profit came from shorts — days that opened above value. That fits the magnet result above, where only opens above value showed a clear pull. But it's a split we made after seeing the data, so treat it as a lead, not a rule.
09Verdict
Yesterday's POC does attract price a little more than chance. Trading the return to it was slightly positive, but not reliably better than random entries.
The magnet is real, but weak: 2.6 percentage points over a random level, and none at all when the day opens inside the value area. The trade built on it earned +0.009R per trade — a result that 51 in 1,000 random versions matched.
If you trade the POC
- Use it as a reference, not a promise. In most sessions that opened outside value, price never got back to it.
- Mind the opening location. Inside the value area, the POC had no pull beyond chance.
- Compare with random levels. Nearby prices get touched often anyway — "it came back" proves little.
10Limitations
- Volume is the CFD broker's tick volume, not real exchange volume. Within each candle it is spread evenly over the range.
- One market (Nasdaq 100), one timeframe (5 minutes), one session (New York cash hours). Overnight trading is ignored.
- The session window uses server time; in a few weeks a year, US and EU daylight-saving changes shift it by one hour.
- Sessions with fewer than 60 candles (holidays, half days) were skipped.
- The random trades enter at any time of the session; the real rule always enters at 9:35. Random trades therefore had less time on average.
- The three stop sizes share the same signals, so they are not independent tests.
The 60-second version
This study started as a Reel. Share it with someone who trades the volume profile.
Next in the research library
- Do fair value gaps actually work? We tested almost 100,000 No usable edge
- Can one 5-minute candle predict the next six hours? Yes — the direction carries
- Does the double top pattern actually work? Worse than random
- Do Bollinger Bands actually predict reversals? in the lab
- Does Fibonacci actually work in trading? in the lab
- Does the weather in New York actually affect the Nasdaq? in the lab