Does the Noise Band strategy actually work?
Our search agents read 196 trading papers and we turned 108 of them into 143 exact rules. Only 2 beat random entries — one of them the Noise Band from the "Beat the Market" research. We then tested it in 200 versions, in six blind walk-forward periods and in MetaTrader 5.
01What is the Noise Band?
Most moves after the open are noise. When price leaves the normal range of that noise, the move tends to run into the close.
The Noise Band comes from "Beat the Market" by Zarattini, Aziz and Barbon (2024), a paper on intraday momentum in the S&P 500 ETF. Its idea: every day, draw a band around the opening price that shows how far the market normally moves by each time of day. Inside the band is noise. A move outside it is unusual — and the paper found that such moves tend to continue until the close. A 2026 paper by Justin Chuk applied the same idea to Nasdaq-100 futures; that is the version our agents picked up.
The band starts narrow and widens through the day, because noise grows with time. A trade starts when price closes outside it; every position is closed by the end of the session, so nothing is held overnight.
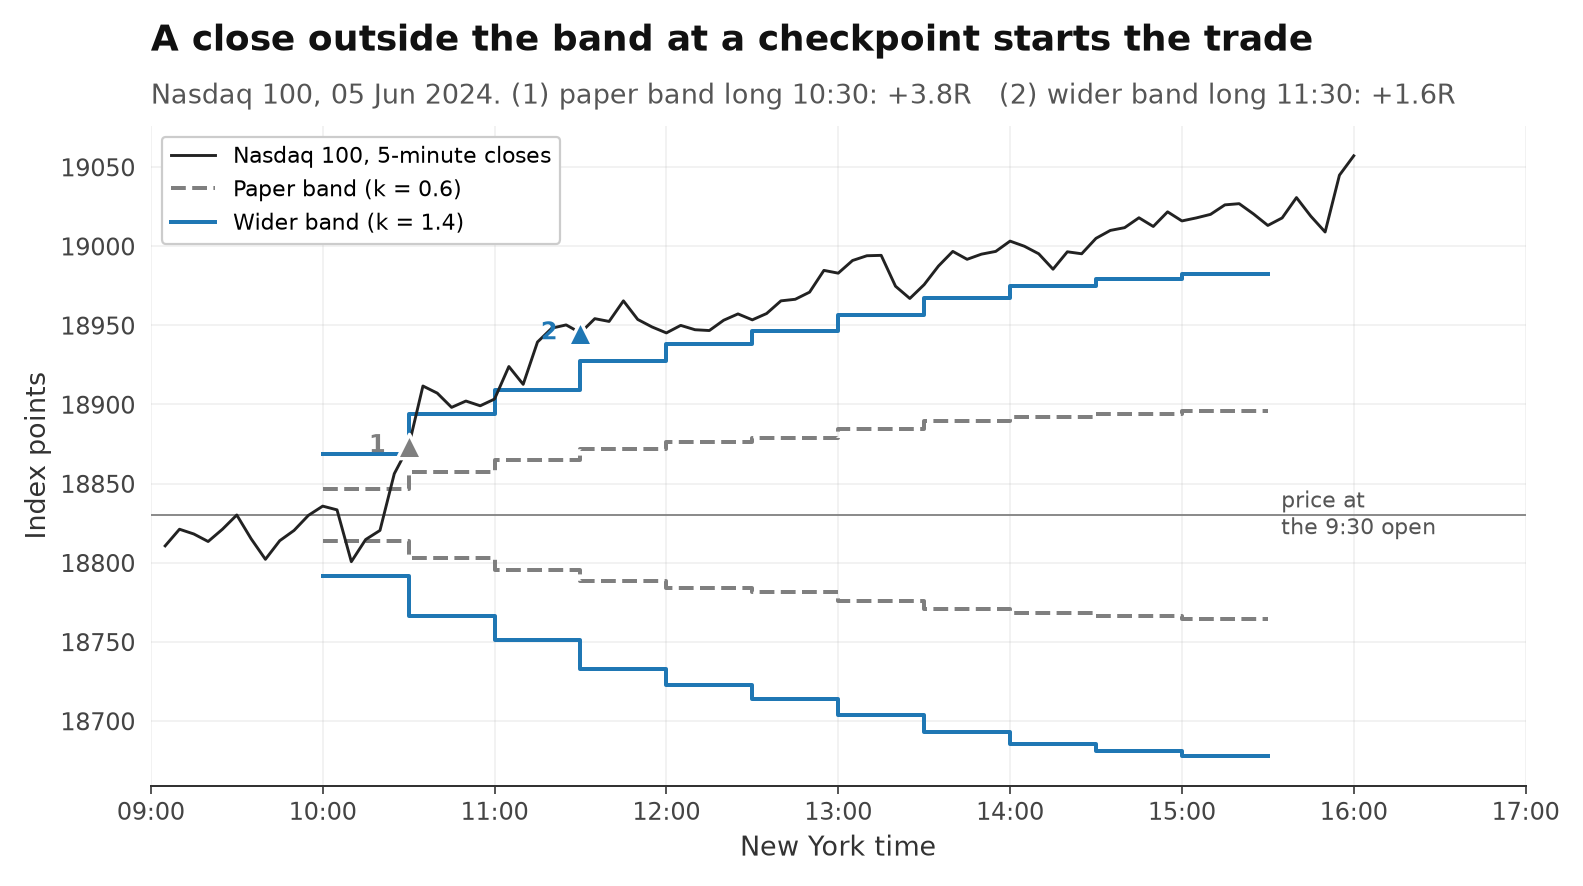
02The exact rules
One question every 30 minutes: has the market moved further than normal noise since the open?
| Paper version | Wider band | |
|---|---|---|
| Reference | Price at the New York open (9:30) | |
| Checkpoints | Every 30 minutes from 10:00 to 15:00 New York time, on closed 30-minute candles | |
| Signal | Move since the open larger than the threshold: long above the band, short below it. Entry at the next candle's open | |
| Band width k | 0.6 | 1.4 |
| Initial stop | 1.5 × ATR | 2 × ATR |
| Trailing stop | 2 × ATR behind the best price, once the trade is 1R in profit | |
| Exit | Stop, trailing stop or the 16:00 close at the latest. Never overnight | |
Two simplifications against the paper: it builds the band from the average move at each time of day over the last 14 days; we use the ATR and the square root of time, which has the same shape and needs no history per time of day. And it uses the S&P 500 ETF; we test the index CFDs our broker offers. Everything is measured in R: the distance to the initial stop is 1R, so +0.1R per trade means you win a tenth of what you risk.
03196 papers, 2 survivors
Most strategies from research papers did not survive our tests. They earned what the market gave everyone.
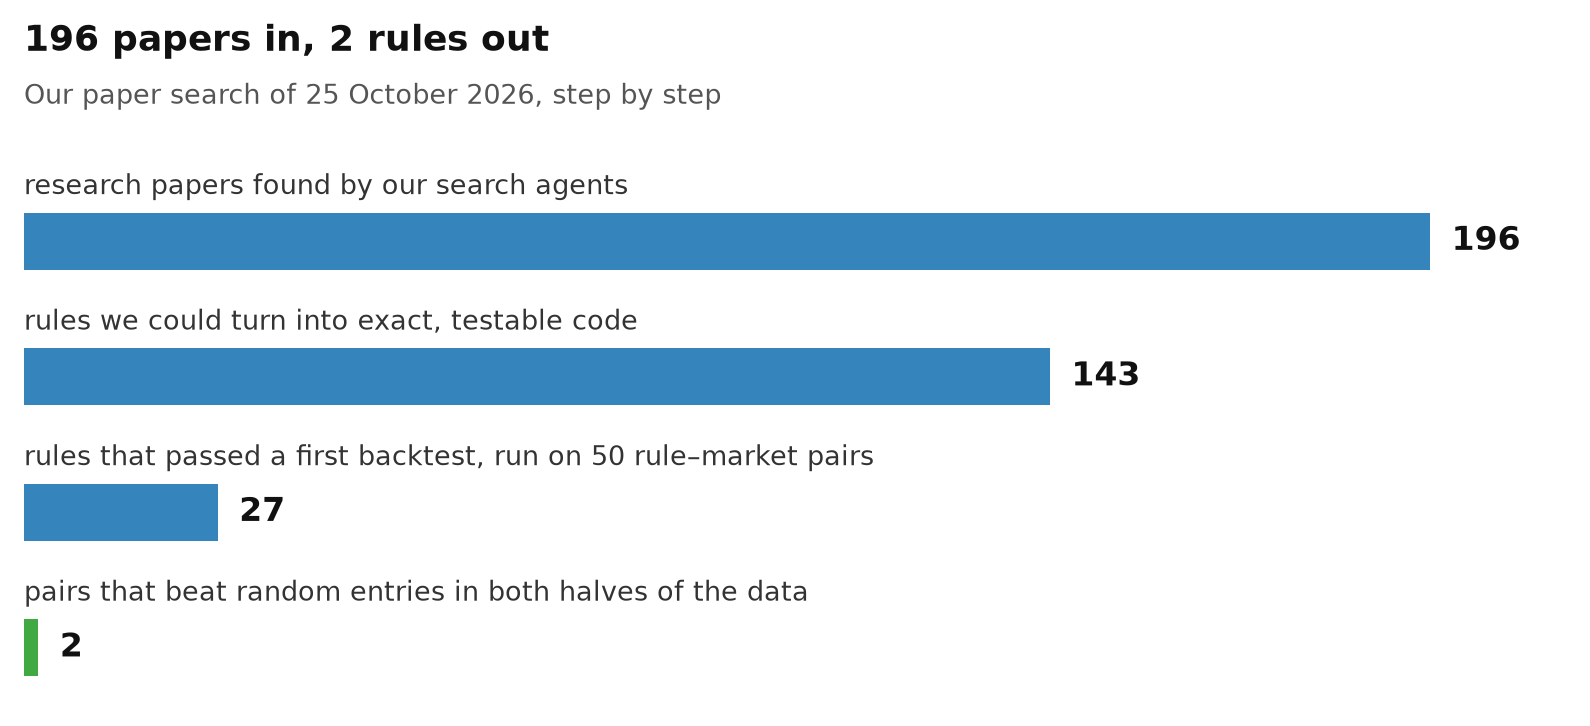
On 25 October 2026 our search agents collected 196 research papers on trading strategies. 143 rules from 108 papers could be written as exact, testable code. 27 of them passed a first backtest on 70 % of the data and the remaining 30 %.
Then the hard part. Each of the 50 rule–market pairs was compared with 200 random copies of itself: same number of trades, same direction, same time of day, same stops and exits, same costs — only the entry was random. An index that rose for years makes almost any long rule look good; this test removes that.
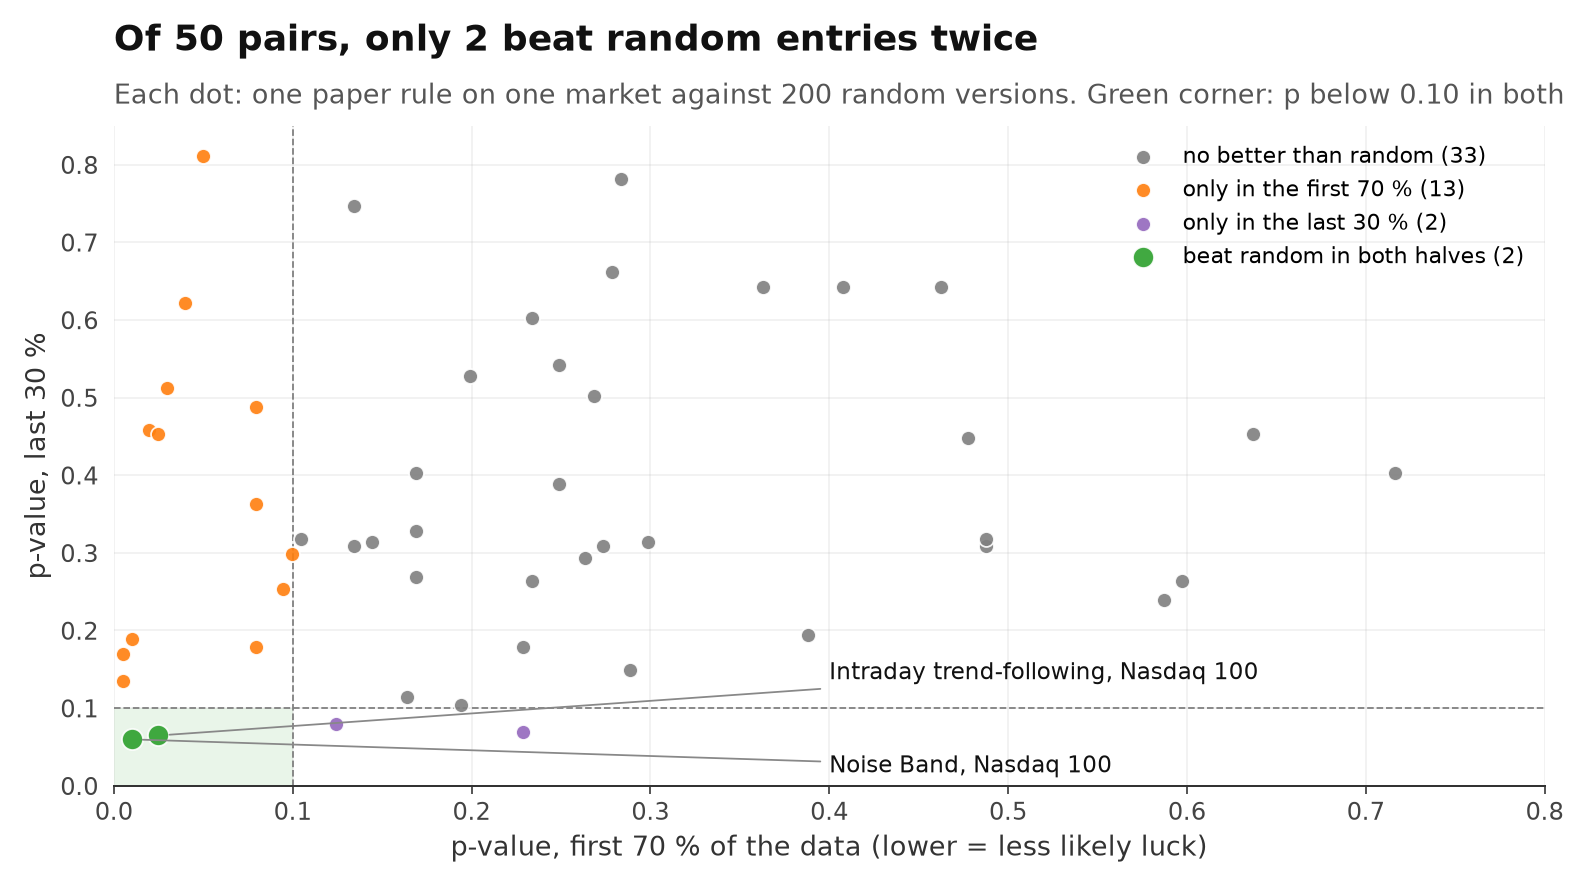
33 pairs made money, but no more than random entries did. 13 beat random only in the first 70 % of the data, 2 only in the last 30 %. Just 2 beat random in both: the Noise Band and an intraday trend-following rule, both on the Nasdaq 100.
On the Nasdaq, the paper's Noise Band made +0.053R per trade in the first 70 % (random: −0.014R, p = 0.01) and +0.070R in the last 30 % (random: −0.015R, p = 0.06). That is a pass, but a narrow one — and our threshold was lenient on purpose (p below 0.10), because this step is meant to throw out what is clearly market drift, not to prove an edge.
If you test 50 pairs, a few will pass by luck. So a pass here only earns a rule the next, harder test. For the Noise Band that was the parameter grid and the walk-forward below.
04The band was too narrow
Of everything we changed, the width of the band made by far the biggest difference.
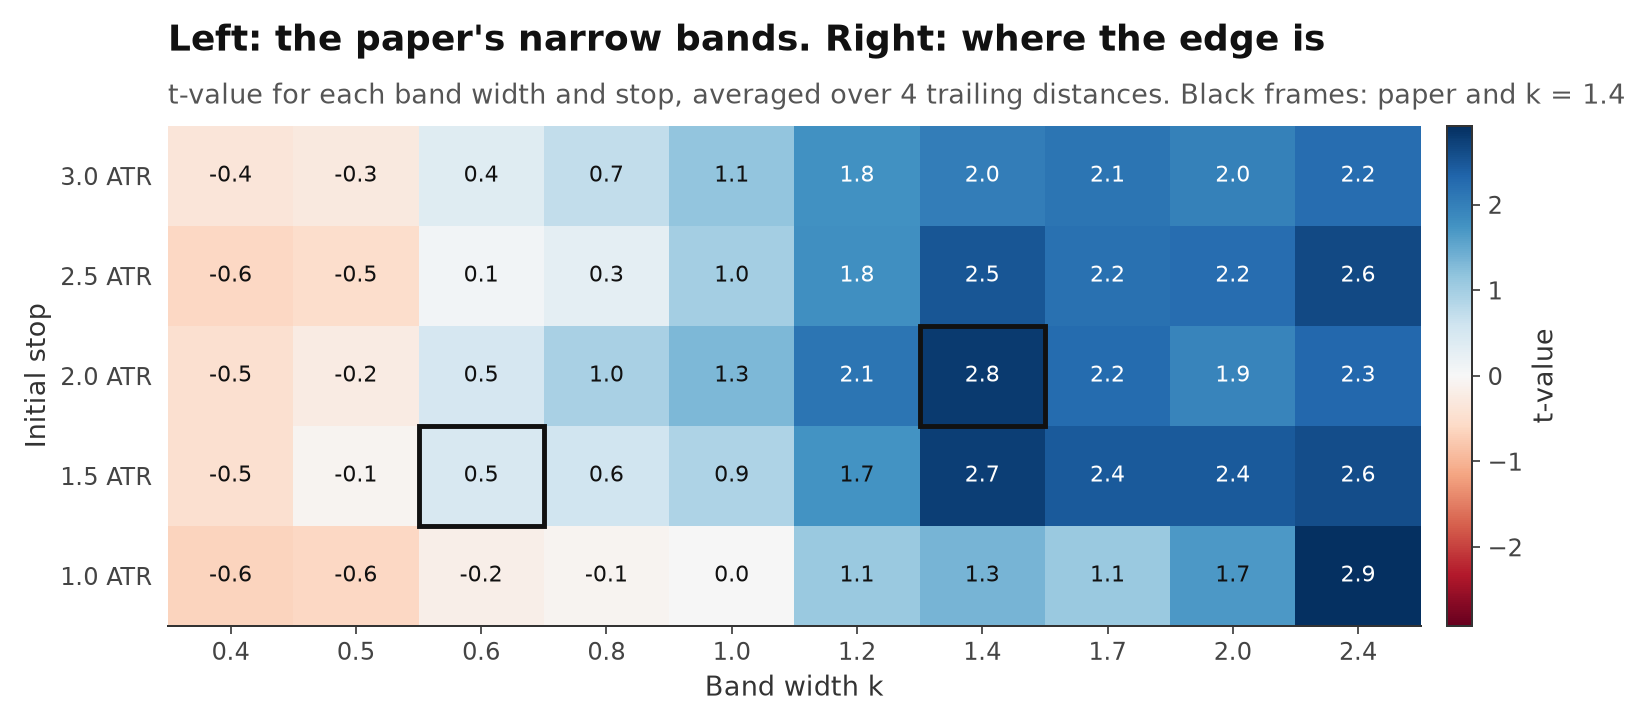
A paper gives you one setting. We tested 200: 10 band widths (k from 0.4 to 2.4) × 5 initial stops × 4 trailing distances, on all four US indices (Nasdaq 100, S&P 500, Dow Jones, Russell 2000), from March 2018 to September 2026.
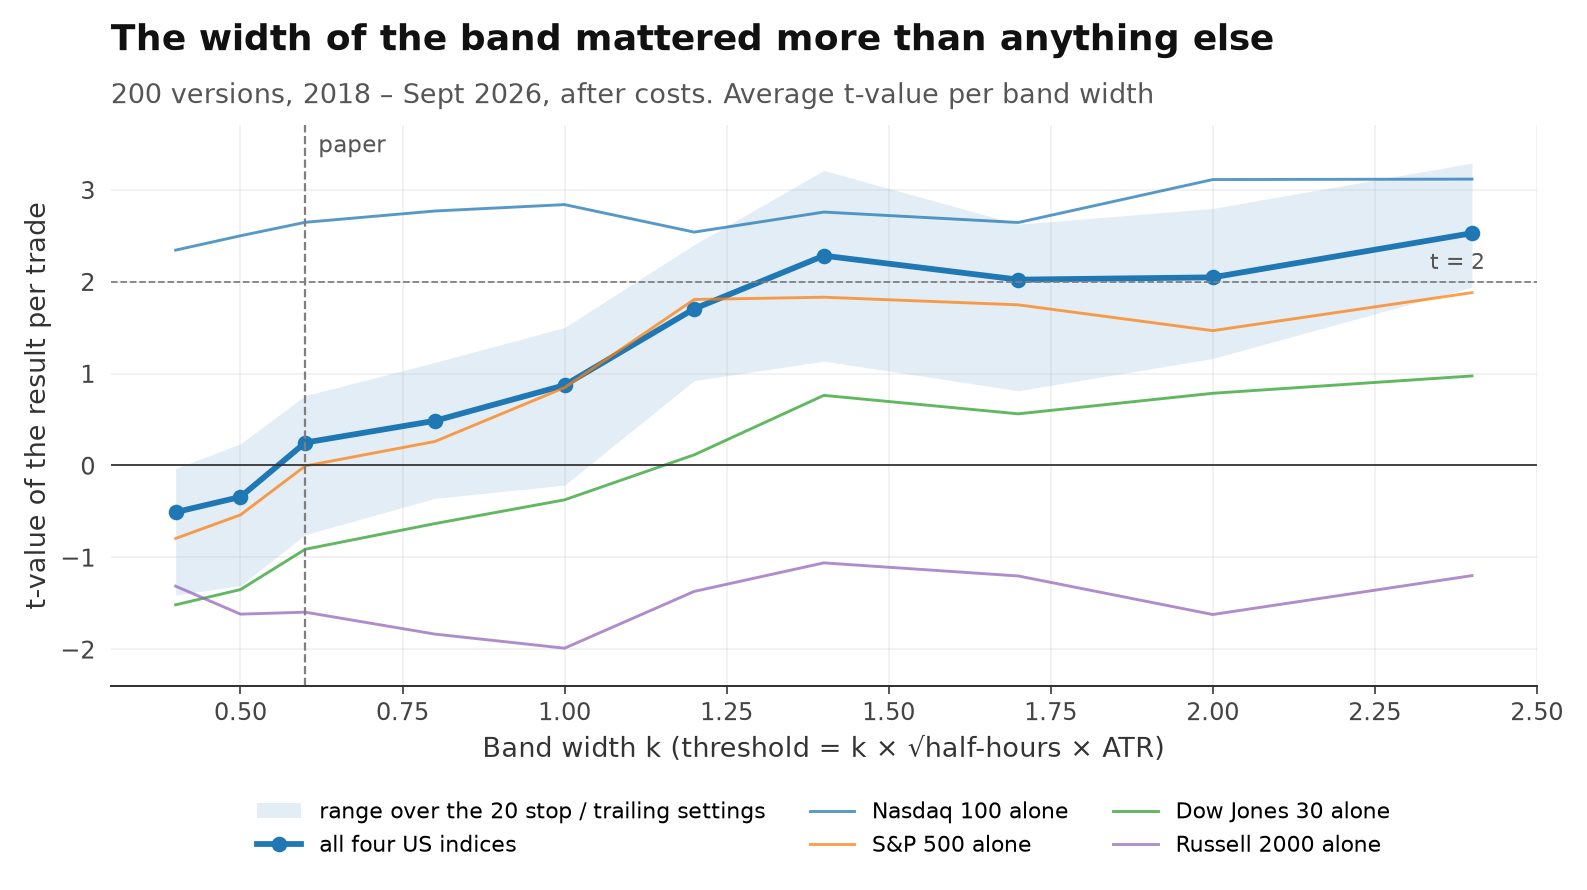
Averaged over everything else, the t-value rose from −0.5 at the narrowest band to 2.5 at the widest. Moving the band width changed the average t-value by 3.0; moving the stop changed it by 0.7 and the trailing stop by 0.2. All 100 versions with k of 1.2 or more were profitable after costs; with k up to 0.6 it was 17 of 60.
| Since 2018 | Paper trades | R/trade | Wider trades | R/trade |
|---|---|---|---|---|
| All four | 13,809 | +0.007R | 5,725 | +0.046R |
| Nasdaq 100 | 3,693 | +0.059R | 1,589 | +0.085R |
| S&P 500 | 3,593 | +0.014R | 1,364 | +0.063R |
| Dow Jones | 3,573 | −0.012R | 1,462 | +0.042R |
| Russell 2000 | 2,950 | −0.043R | 1,310 | −0.016R |
Why would a wider band help? The narrow band is crossed on almost every day, so it also trades ordinary noise: 13,809 trades against 5,725. The wider band only trades days that really move — fewer trades, more per trade.
One honest caveat: on the Nasdaq alone, the paper band worked too. It made more in total (+216R against +134R), just with far more trades and less per trade. The narrow band was close to zero on the S&P 500 and lost on the Dow and the Russell 2000. The wider band was positive on three of the four.
05Walk-forward: six blind tests
Pick the setting on the past, trade it on a future the choice has never seen. Six times in a row.
A grid always has a best cell, and in hindsight it always looks great. That proves nothing. So we let a fixed rule choose: in each step it looked at the previous 36 months only, picked the setting with the best plateau (a cell and its neighbours, not a lone peak) and then traded it for the next 12 months. Then it moved forward a year and did it again.
| Test year | Chosen k | Stop (ATR) | Trades | Result |
|---|---|---|---|---|
| Mar 21 – Mar 22 | 2.4 | 1.0 | 260 | +47.6R |
| Mar 22 – Mar 23 | 2.4 | 1.0 | 220 | +84.5R |
| Mar 23 – Mar 24 | 2.4 | 1.0 | 254 | −32.4R |
| Mar 24 – Mar 25 | 2.4 | 1.0 | 294 | −8.2R |
| Mar 25 – Mar 26 | 1.2 | 2.0 | 950 | +87.4R |
| Mar 26 – Sep 26 | 1.7 | 3.0 | 274 | −4.1R |
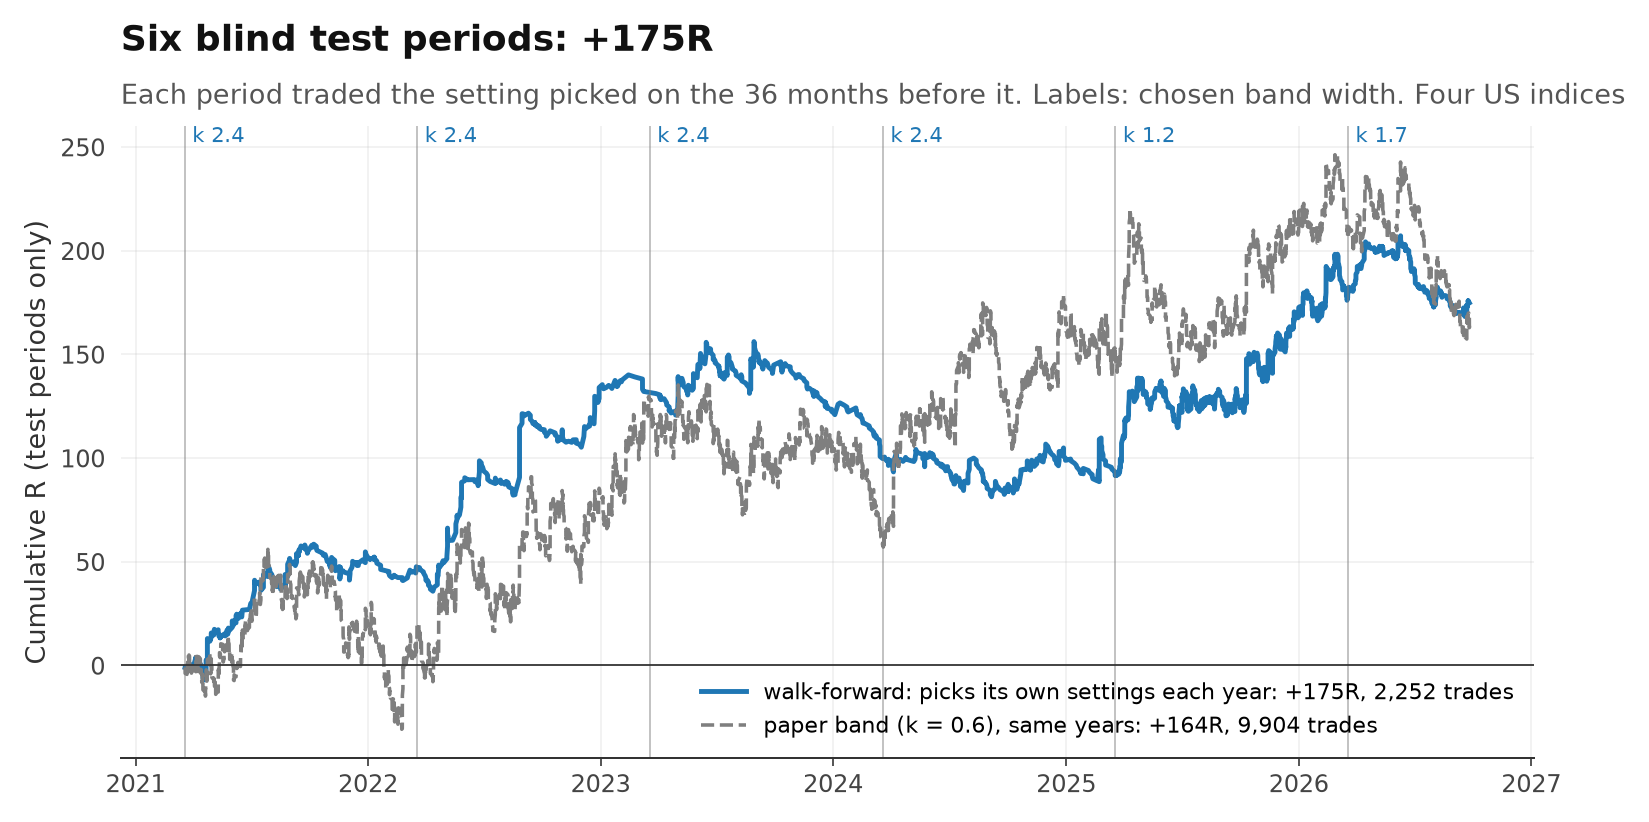
Chained together, the test periods made +174.9R over 2,252 trades (+0.078R per trade, t = 2.59) in 5.5 years, after costs. Every time, the choice landed on a wide band: k between 1.2 and 2.4. Only 3 of the 6 test periods were positive; the others lost money, the worst −32.4R.
The paper band in the same years made a similar total — +163.8R — but needed 9,904 trades for it (+0.017R per trade, t = 1.24), with much deeper dips. And that comparison flatters the paper band: it had already been picked on these same years in the first step.
06Against 2,000 blind runs
An optimiser that only finds noise also produces good test years sometimes. So we measured how often.
We ran the exact same selection rule 2,000 times on scrambled training results — each run picked settings by the same rules, but without any real information. If our walk-forward result is no better than these blind runs, the optimisation found nothing.
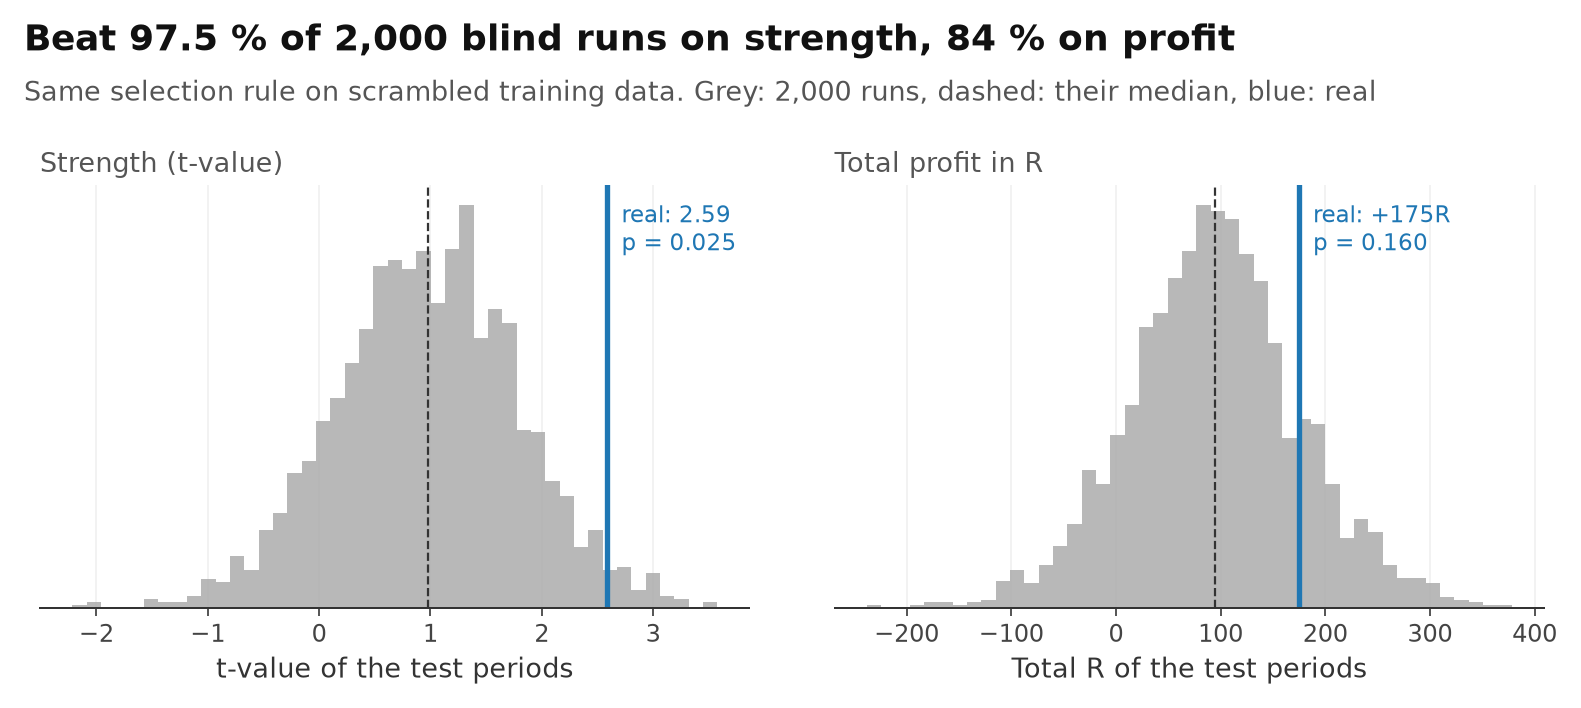
On strength, the real walk-forward beat 97.5 % of the blind runs (p = 0.025). On total profit it beat only 84 % (p = 0.160). That gap is telling: the typical blind run still made +94R, because most settings of this rule made money. What the real choice added was consistency — similar profit with far fewer, better trades — more than extra profit.
07Costs
The paper band trades so often that costs eat almost all of it. The wider band keeps a cushion.
Every trade pays the spread, calibrated against MetaTrader 5 runs on our broker: 1.2 index points on the Nasdaq 100 and 0.6 on the S&P 500. A typical trade costs about 3 % of its risk with the wider band and 4 % with the paper band (its stop is tighter).
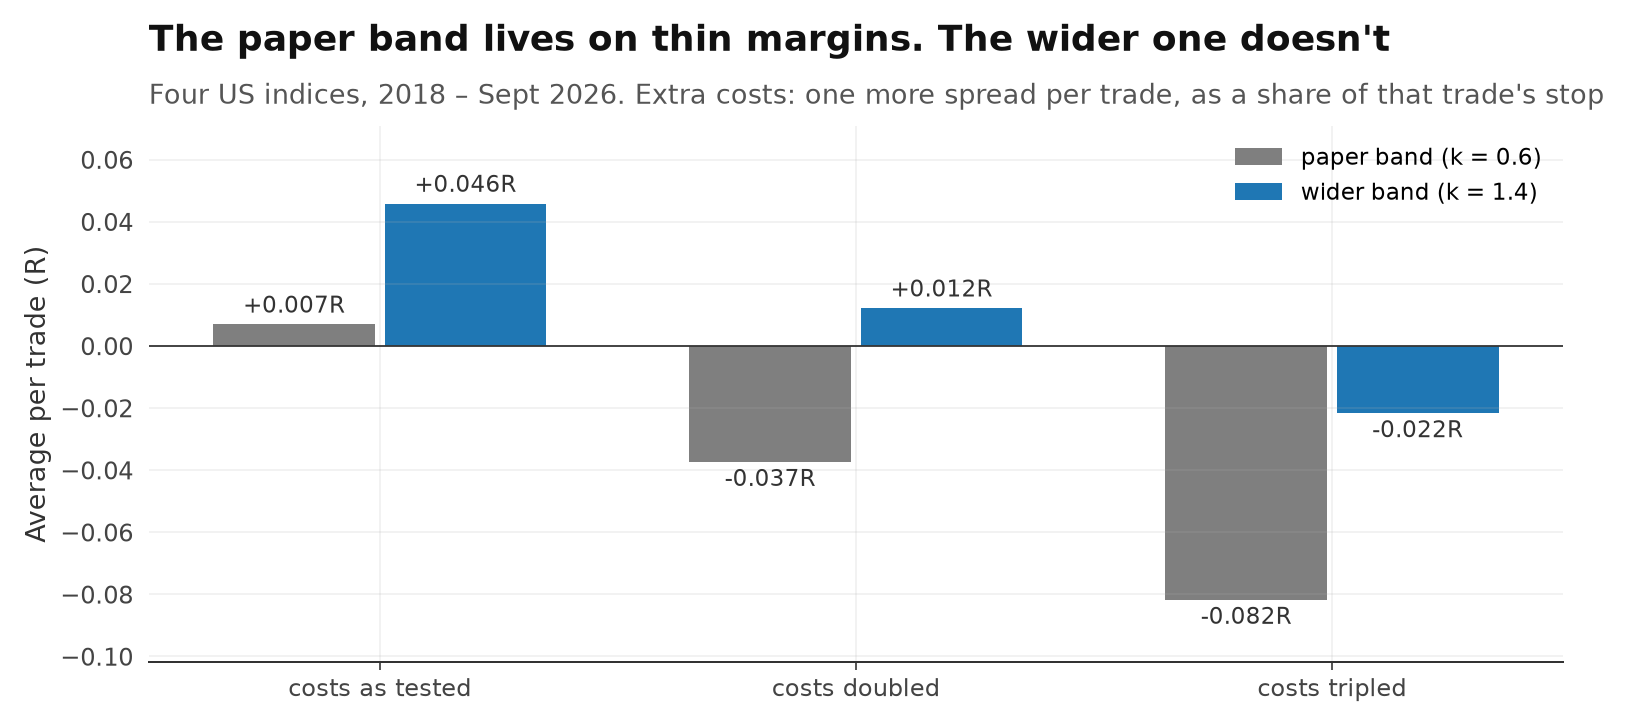
Across the four indices, the paper band paid about 612R in costs to keep +95R. Double the costs and it turns negative (−0.037R per trade). The wider band paid about 193R and kept +262R; with double costs it still made +0.012R. If your broker's spread is much wider than ours, this strategy is not for you.
08The MetaTrader 5 check
A Python backtest is not a trading platform. So both versions ran as real Expert Advisors in MetaTrader 5.
We coded both bands as MQL5 Expert Advisors and ran them in the MetaTrader 5 strategy tester on our broker's data: "every tick" model, real spreads and commission, 1 % risk per trade, starting balance 10,000, October 2021 to October 2026. This is not a new test period — those years were walk-forward test years. It checks that the rule survives real execution, not just our own engine.
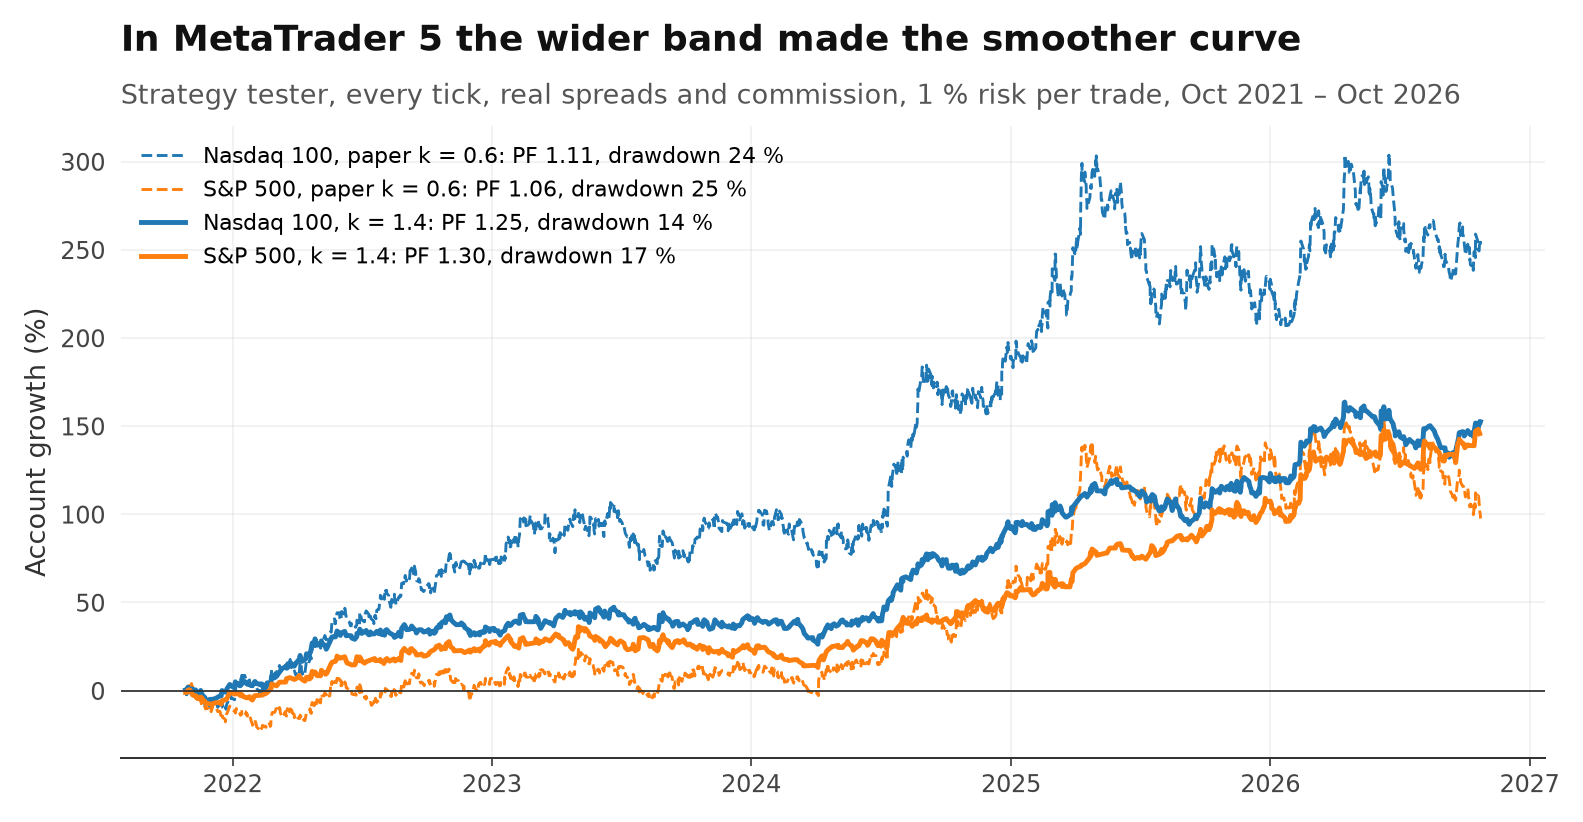
| MT5, 5 years | Profit factor paper | wider | Drawdown paper | wider |
|---|---|---|---|---|
| Nasdaq 100 | 1.11 | 1.25 | 24 % | 14 % |
| S&P 500 | 1.06 | 1.30 | 25 % | 17 % |
| Dow Jones | 0.97 | 1.02 | 38 % | 24 % |
Trades: 2,125 (paper) against 918 (wider) on the Nasdaq 100, 2,077 against 780 on the S&P 500. Win rate of the wider band: 51 % and 51 %.
The wider band had the higher profit factor on every market and smaller drawdowns. But read the Nasdaq row carefully: the paper band grew the account more there (+253 % against +153 %) — with a 24 % drawdown instead of 14 %. On the Dow, neither version was worth trading.
09Verdict
The Noise Band was one of 2 survivors among 50 paper rules, its best settings form a broad plateau, and a blind walk-forward made +175R — stronger than 97.5 % of 2,000 blind runs. But the paper's own band width was too narrow for most markets.
So does the Noise Band work? On the evidence we have: the idea is real, and it is one of very few paper strategies that held up in our tests. The paper's setting is the weak part. A band about twice as wide traded less than half as often, made more per trade, survived higher costs and had smaller drawdowns.
Keep the size of the edge in perspective: +0.046R per trade on four indices, roughly every second trade a loser, and half of the walk-forward periods flat or negative. This is a strategy for patient traders, not a money machine — and past results do not guarantee future results.
If you trade the Noise Band yourself
- Use a wider band than the paper. k between 1.2 and 2.4 did better than 0.6 almost everywhere.
- Stick to the Nasdaq 100 and the S&P 500. The Dow was flat, the Russell 2000 lost.
- Check your costs. With double our spread, the paper band loses money.
- Expect losing years. 3 of 6 walk-forward test periods lost money.
- Mind the overlap. Nasdaq and S&P 500 often signal on the same day, so losses tend to come together.
10Limitations
- No untouched period is left. The paper rule was picked on 2018–2026, and the wider band (k = 1.4) was chosen after the walk-forward had seen all test years. It is also the best single setting in hindsight.
- The MT5 years (October 2021 to October 2026) were walk-forward test years, and the risk per trade was chosen afterwards.
- The Noise Band was selected from 50 candidates. That multiple testing is not in any p-value on this page.
- Only 6 walk-forward periods, the last one six months long. 3 of them lost money.
- Our band is a simplified version of the paper's (ATR × √time instead of the 14-day average move per time of day), tested on index CFDs of one broker, not on the ETF or futures.
- Thirty-minute candles, no tick data in Python. When a stop and a new high fall in the same candle, the stop is counted.
- A live forward test on a demo account has only just started and is not part of this study.
Sources: Zarattini, C., Aziz, A., Barbon, A. (2024), "Beat the Market: An Effective Intraday Momentum Strategy for S&P500 ETF (SPY)", SSRN 4824172. Justin Chuk (2026), "Noise-band Intraday Momentum in Nasdaq-100 Futures", SSRN.
The 60-second version
This study started as a Reel. The follow-up Reel, "The research paper got the band wrong", covers the 200 versions. The full rules and every check are above.
Next in the research library
- Do fair value gaps actually work? We tested almost 100,000 No usable edge
- Can one 5-minute candle predict the next six hours? Yes — the direction carries
- Does the double top pattern actually work? Worse than random
- Do Bollinger Bands actually predict reversals? in the lab
- Does Fibonacci actually work in trading? in the lab
- Does the weather in New York actually affect the Nasdaq? in the lab