Does a simple ICT strategy beat 1,000 random traders?
We took one simple, textbook ICT setup — a liquidity sweep followed by a fair value gap — and traded it on the Nasdaq 100 for six and a half years. Then we let 1,000 random traders take the same number of trades with the same stops, the same target and the same hours.
01The ICT idea
ICT says big players hunt the stops above old highs and below old lows — and then move price the other way.
ICT ("Inner Circle Trader") is one of the most popular trading styles on social media. Two of its core ideas are simple enough to test:
- Liquidity sweep. Many traders put their stops just above a recent high or below a recent low. Price spikes through that level, triggers the stops — and snaps back. That spike is the "sweep".
- Fair value gap (FVG). When price moves away fast, three candles can leave a gap: the third candle does not overlap the first. ICT reads this as a sign that the "smart money" is now pushing in the new direction.
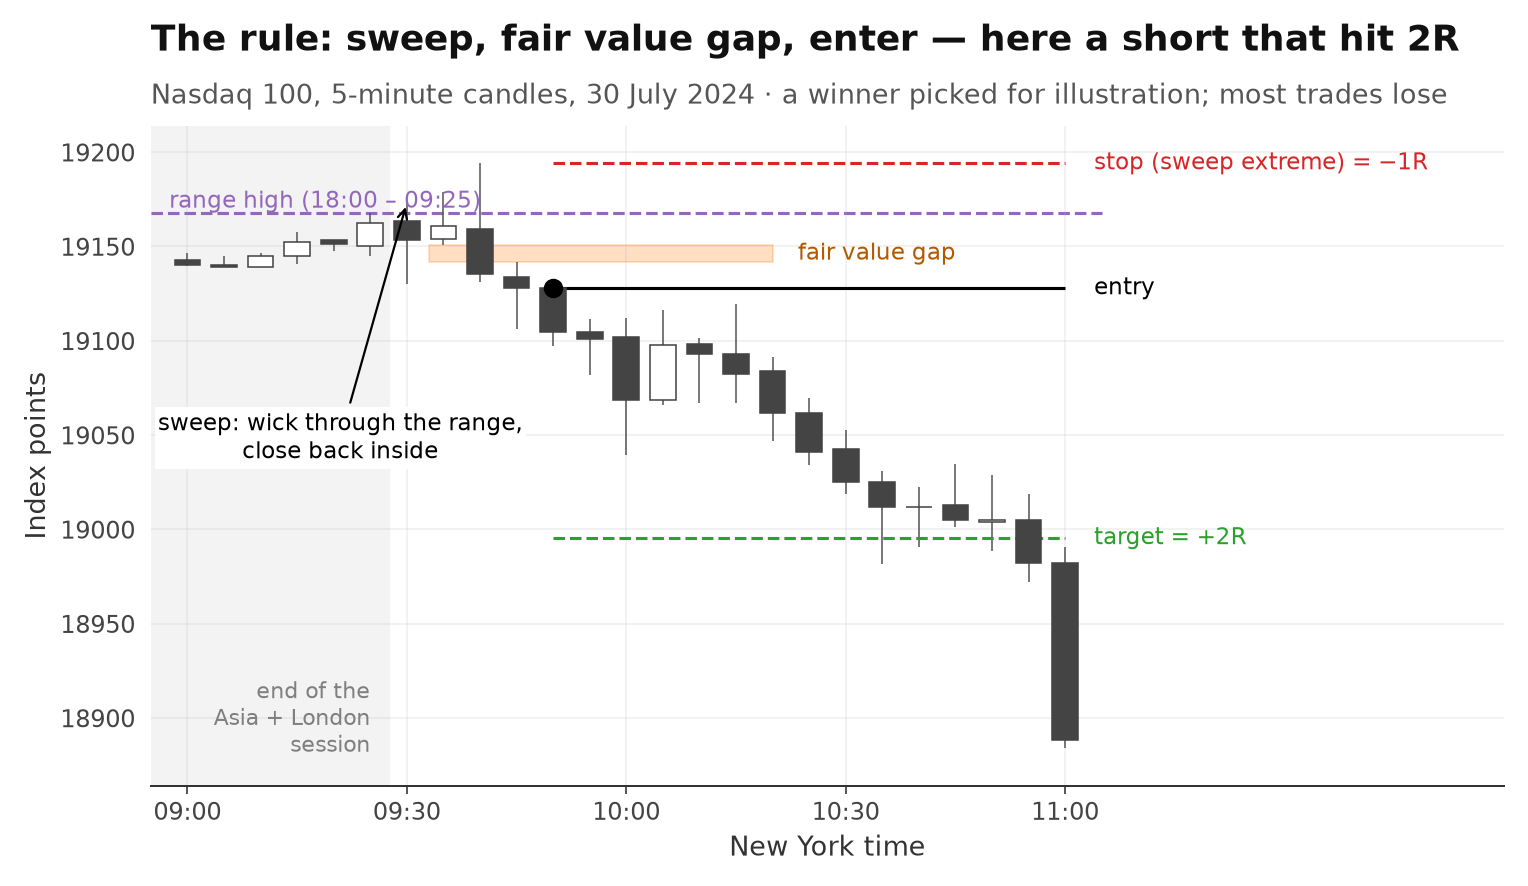
Put together: wait for a sweep of the overnight range, wait for a fair value gap in the opposite direction, and trade with it. This is not a fringe reading — it is one of the most common ICT setups, and it fits the New York morning session that ICT traders focus on.
02What we tested
One fixed version of the setup, written down before the test. No setting was tuned afterwards.
We wanted a fair test. So we did not invent our own variant, we picked a simple, standard one. All times are New York time:
- Range: the high and low from 18:00 the evening before to 09:25 — the Asia and London sessions
- Sweep: between 09:30 and 12:00, the first 5-minute candle that wicks above the range high and closes back below it (short setup), or wicks below the low and closes back above it (long setup)
- Fair value gap: within the next hour, a three-candle gap in the direction of the reversal
- Entry: at the open of the candle after the gap, at the latest 12:55. One trade per day at most
- Stop: at the extreme of the sweep. Target: 2R. Anything still open is closed at 15:55
Market: Nasdaq 100 (CFD), 5-minute candles, January 2020 to June 2026. The 2R target was set as the main test before any result was known; 1R and 3R are checks. The setup fired on 814 of 1,677 trading days (48 %): 375 long and 439 short trades.
03How a trade is counted
A gap is only known once its third candle has closed. So every trade enters at the open of the next candle.
| Entry | Open of the candle after the fair value gap is complete |
|---|---|
| Risk unit | 1R = distance from entry to the sweep extreme (median 68.7 index points); at least 0.25 × ATR(14) |
| Exit | Stop (−1R), target (+2R) or the close of the 15:55 candle. If stop and target fall in the same candle, we count the stop |
| How trades ended | 53 % at the stop, 19 % at the target, 28 % closed in the afternoon |
| Costs | Real spread at entry plus 0.5 index points slippage; median 0.029R per trade |
We measure in R, not dollars. −0.1R per trade means: on average you lose a tenth of what you risk on each trade.
If every winner made the full 2R, winning one trade in three would be enough to break even before costs. The rule won 40.3 % of its trades — which sounds like plenty. But only 18.8 % reached the 2R target; the other winners were closed in the afternoon with a smaller gain.
041,000 random traders
A random trader copies everything about the rule — except the reason for the trade.
A backtest on its own proves little. Any rule makes or loses something. The real question is: does the setup choose better moments than chance?
So we built 1,000 random traders. Each one takes exactly 814 trades, and for every real trade it has a twin:
- the same stop distance in points and the same target (2R)
- the same hour of the New York session, and the same afternoon exit
- the same costs, and the same split before and after 2024
- but a random day, a random candle in that hour, and a random direction
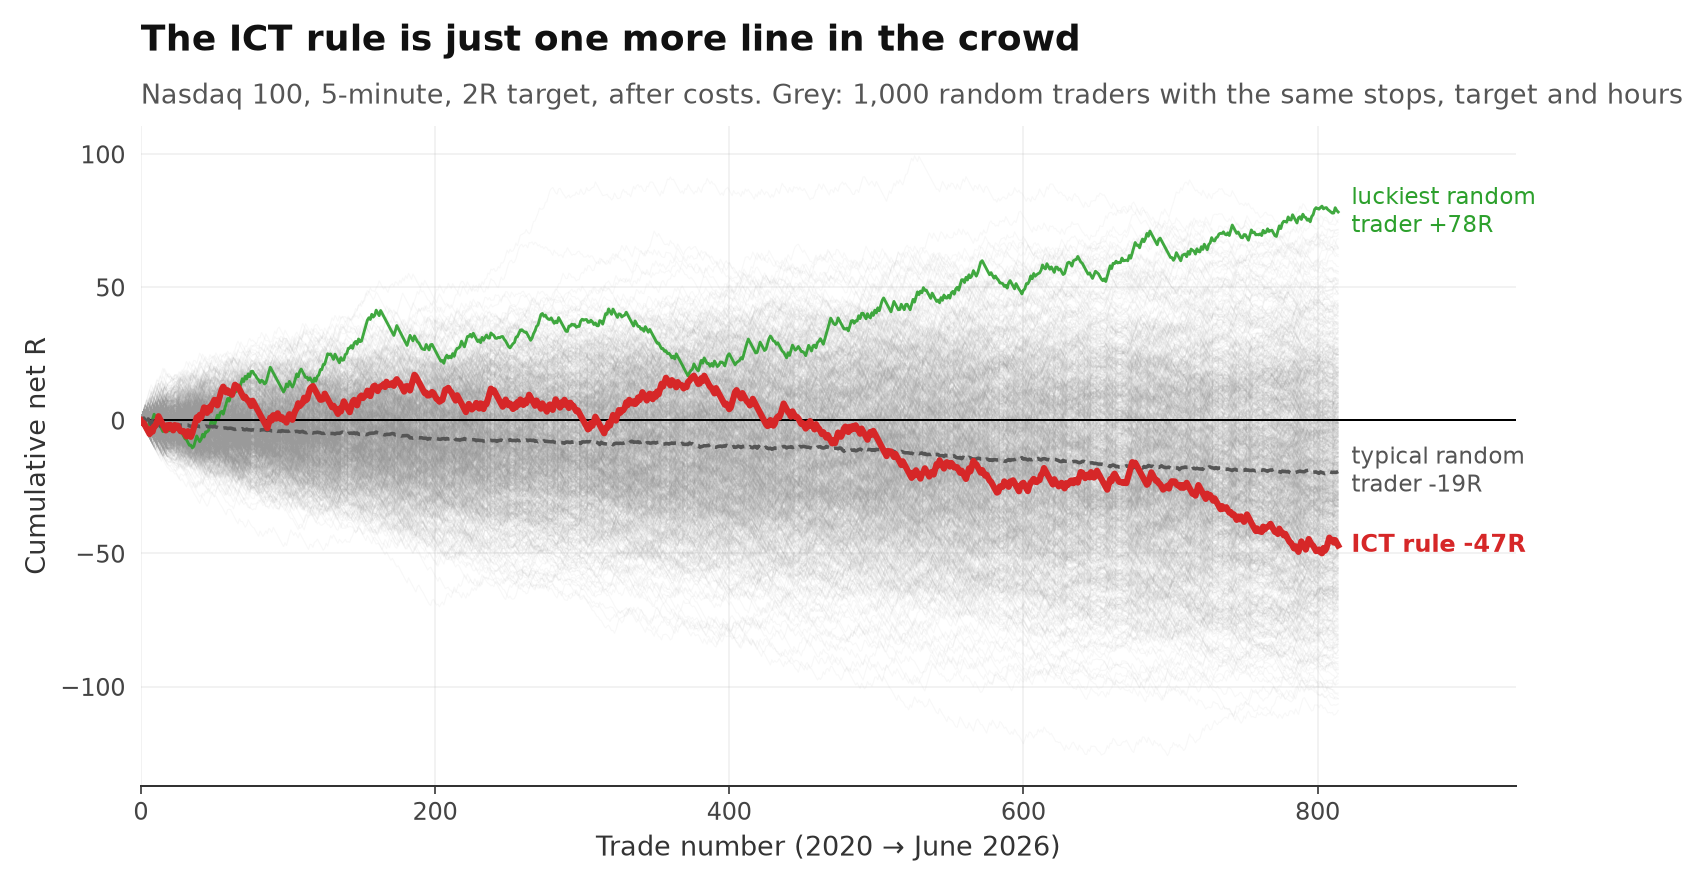
The result is a cloud of 1,000 possible outcomes for a trader with exactly the same risk profile and no information at all. If the ICT rule has an edge, its line should sit near the top of that cloud.
05What luck looks like
Coin flips with good risk management produced plenty of winners. That is the trap in every screenshot of a profitable account.
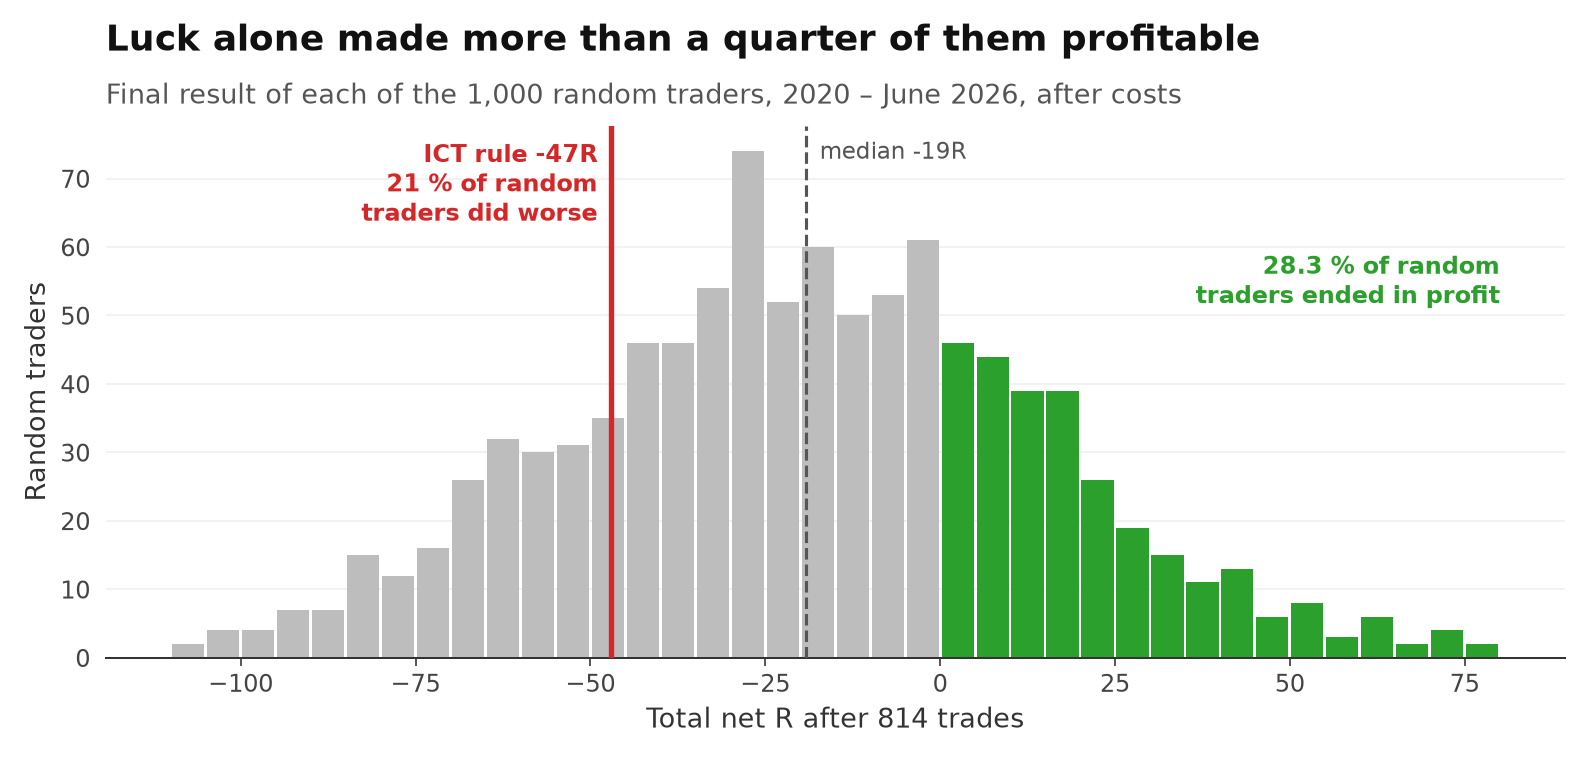
The typical random trader lost 19.2R over the six and a half years — mostly costs. But 28.3 % of them ended in profit. The best 5 % made more than +36R, and the luckiest one +78R.
Not one of them had a strategy. If 1,000 people trade the same setup, a few hundred will make money and some will look like geniuses. They are the ones who post their results.
06Where the rule lands
The ICT rule finished below the typical random trader. It did not beat luck.
"Better than 95 % of random traders" means only 1 in 20 coin-flip traders did as well — that is what an edge looks like. 50 % means the rule is indistinguishable from chance. Below 50 % means most random traders did better.
| 2R target, 2020 – June 2026 | ICT rule | Typical random trader |
|---|---|---|
| Total after costs | −47.0R | −19.2R |
| Per trade | −0.058R | −0.024R |
| Profit factor | 0.90 | 0.95 |
| Largest drawdown | 67R | 47R |
The rule beat 20.6 % of the random traders (p = 0.79). In other words, 79 % of them did better.
To be fair: that does not prove the setup is worse than chance. A rule that is truly worse would sit below 5 %, and this one does not. What the numbers say is simpler: there is no sign it is better.
Was our sweep too loose?
A fair question from any ICT trader. Our rule takes the first candle that pokes through the range and closes back inside. On 46 % of the trades, price had already closed outside the range earlier that morning — more a breakout that failed than a clean stop hunt. So we split the trades afterwards:
- Clean sweeps (no earlier close outside the range), 438 trades: −0.133R per trade
- The rest, 376 trades: +0.030R per trade
The textbook version did worse, not better. A stricter sweep definition would not have rescued the rule. (This split was made after the test, so it is a check, not a new strategy.)
A second, differently built random test gave the same answer. Instead of random days and directions, we kept every real trade's direction and time of day and only moved it to a random other day. The rule beat 23.6 % of those versions.
07Costs
Costs made it worse, but they are not the reason. Before costs the rule was already behind the random traders.
Each trade paid the real spread plus 0.5 index points. With a median stop of 68.7 points that is about 2.9 % of the risk per trade — small, but it adds up over 814 trades.
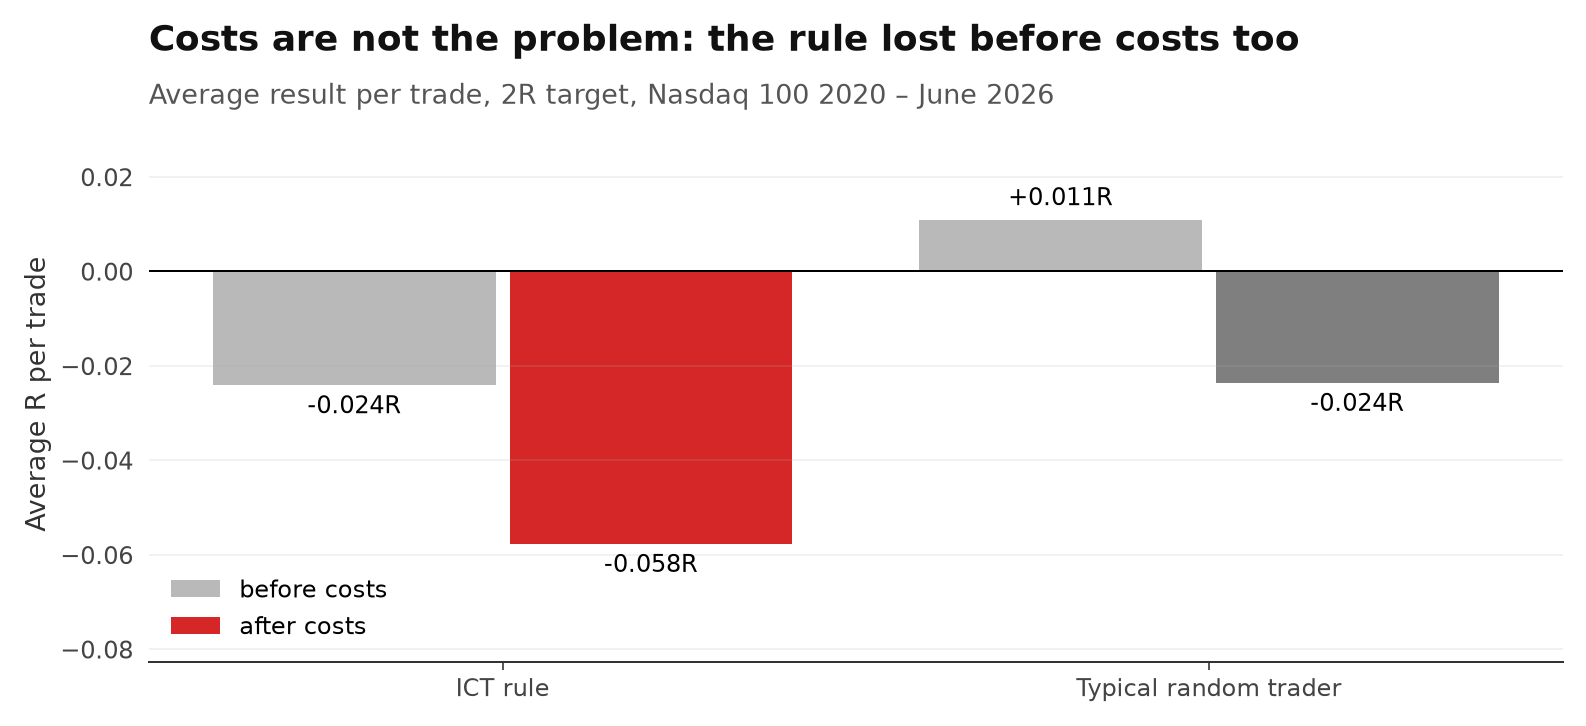
Before costs, the rule made −0.024R per trade (−19.6R in total). The typical random trader made +0.011R. The rule was behind before a single cent of cost was charged.
081R, 2R or 3R?
Changing the target changes the win rate — not the result against chance.
Maybe 2R is just the wrong target? We ran the same entries with a 1R and a 3R target. Each version got its own 1,000 random traders with the same target.
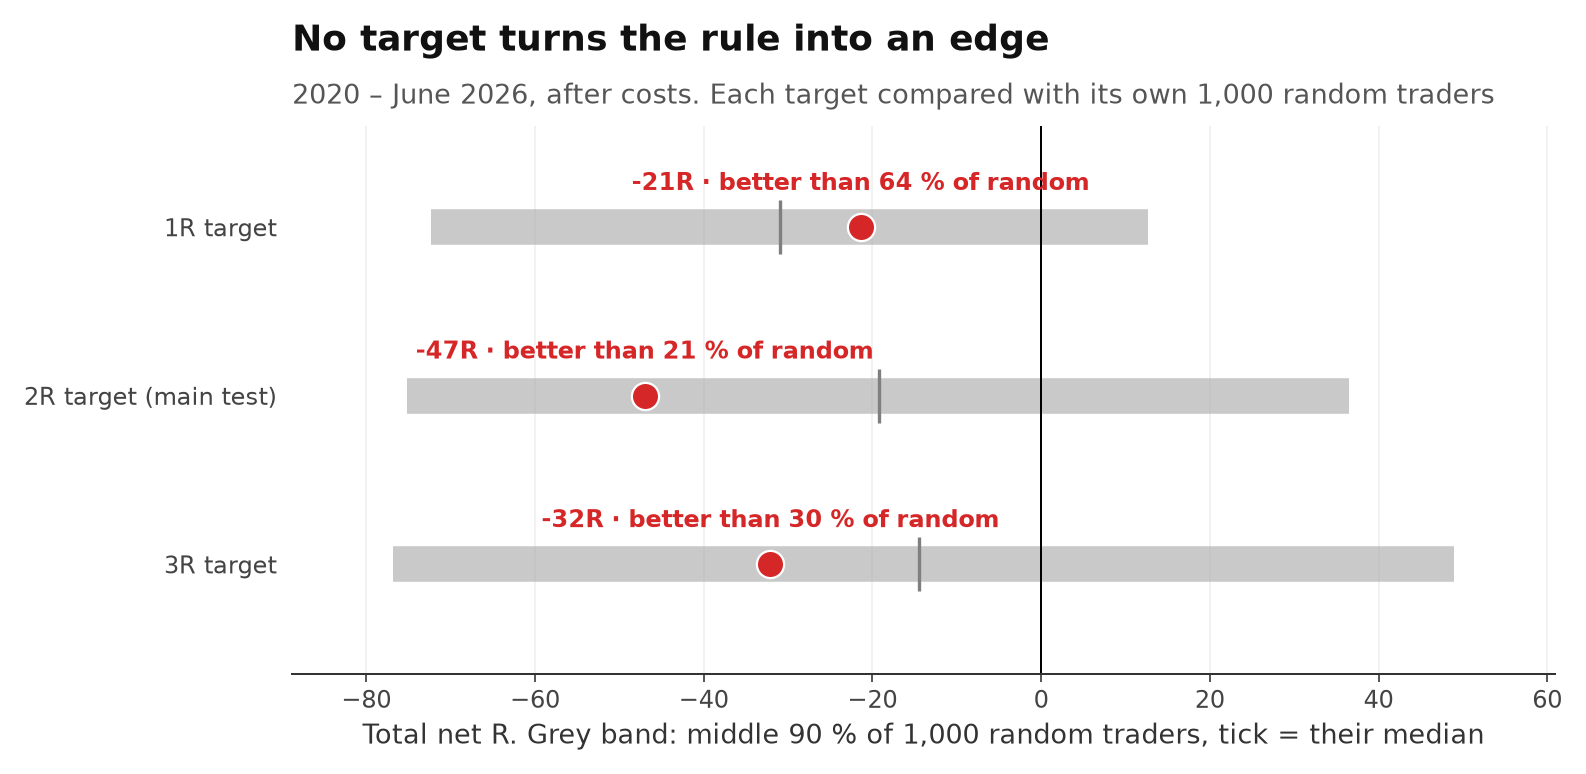
| Target | Win rate | Per trade | Total | Beats random | p-value |
|---|---|---|---|---|---|
| 1R | 50.9 % | −0.026R | −21.4R | 64.5 % | 0.36 |
| 2R (main test) | 40.3 % | −0.058R | −47.0R | 20.6 % | 0.79 |
| 3R | 38.5 % | −0.039R | −32.1R | 29.7 % | 0.70 |
All three lost money after costs. The 1R version came closest: it beat 64.5 % of its random traders — still far from the 95 % an edge would need. And with three targets tested, one of them looking a little better is what you would expect by chance.
09Before and after 2024
2020–2023 is the period anyone could have looked at. 2024–2026 is the test the rule never saw.
We split the data in two. If the rule only worked in the past, the second half shows it.
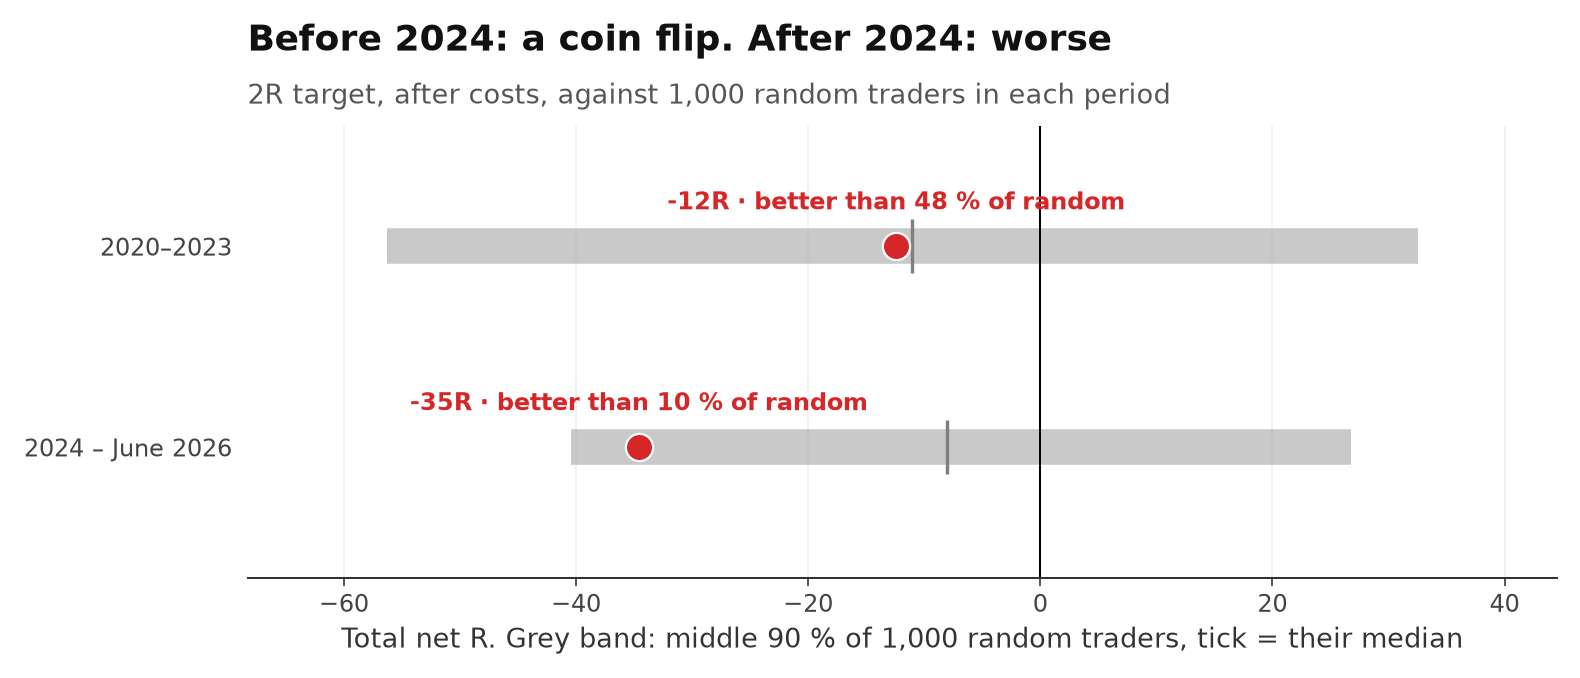
| 2R target | Trades | Per trade | Total | Random median | Beats random |
|---|---|---|---|---|---|
| 2020–2023 | 506 | −0.025R | −12.4R | −11.1R | 48.0 % |
| 2024 – June 2026 | 308 | −0.112R | −34.6R | −8.1R | 9.7 % |
| Whole period | 814 | −0.058R | −47.0R | −19.2R | 20.6 % |
Before 2024 the rule sat right in the middle of the random traders (48.0 %). After 2024 it lost 34.6R on 308 trades, while the typical random trader lost about 8R. Only 9.7 % of random traders did worse.
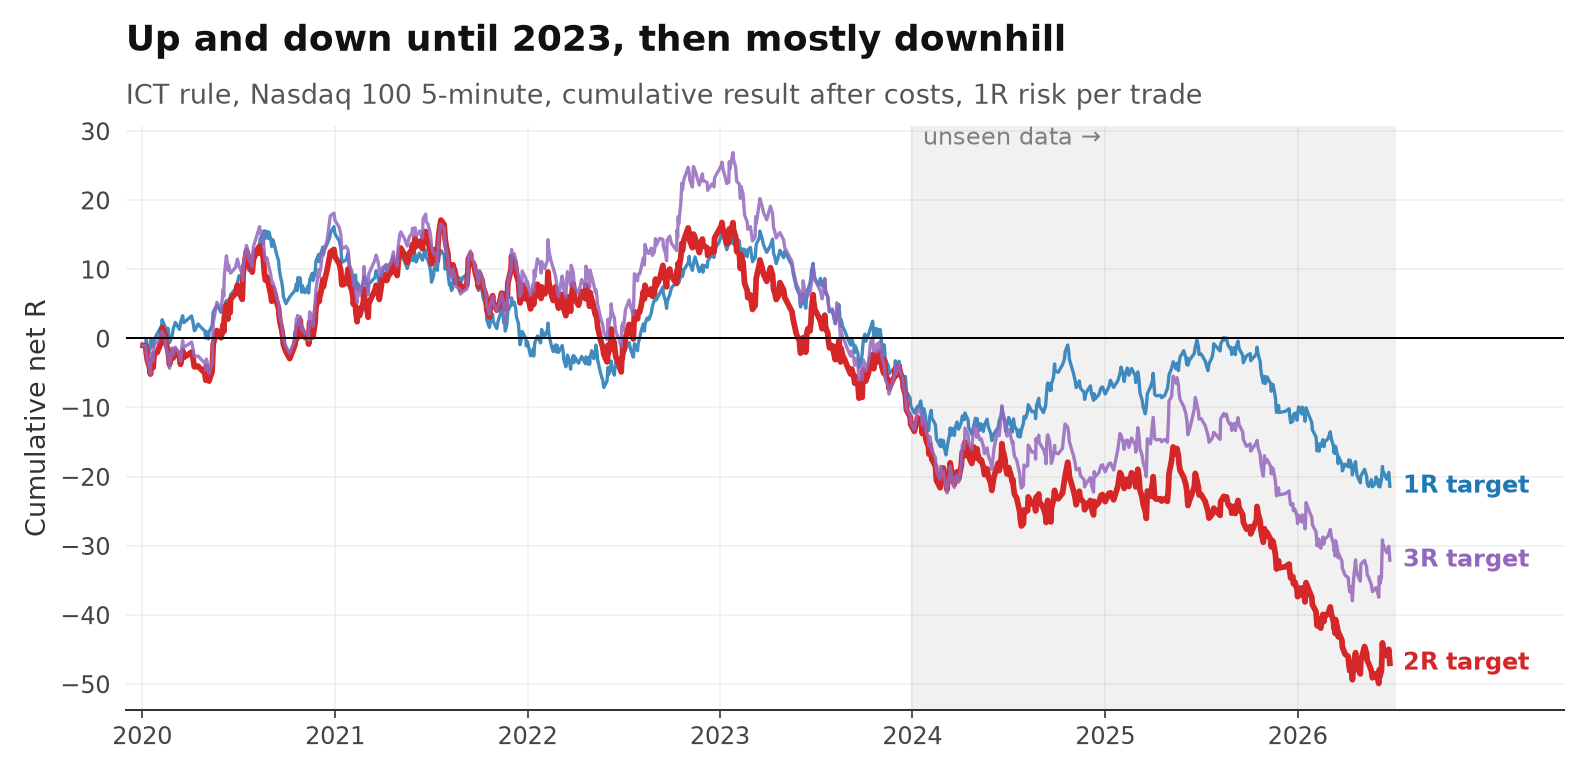
At 1 % risk per trade, the 2R version would have lost 41.1 % of the account over the whole period, with a largest drawdown of 67R.
Long trades held up better than shorts (−0.015R against −0.094R per trade) — in a market that mostly rose, that is no surprise, and neither side made money.
10Verdict
On 814 Nasdaq trades, a simple sweep-and-fair-value-gap rule finished behind 79 % of random traders with the same stops, target and hours. No target fixed that, and on data after 2024 it got worse.
The setup is easy to see on a chart and easy to believe in: the sweep, the gap, the clean move to target. Figure 1 is a real trade. But a chart full of examples is exactly what 28.3 % of coin-flip traders could show you, too.
If you trade ICT setups
- Compare against random, not against zero. A profitable backtest proves nothing until it beats traders with the same risk and no signal.
- Be careful with screenshots. With enough traders, luck alone produces impressive accounts.
- Write the rule down before you test it. If a setup only works when you look at it in hindsight, it is not a rule yet.
11Limitations
- This is one version of ICT. Other definitions — order blocks, other kill-zone times, a different stop, a higher-timeframe bias filter — were not tested and may behave differently.
- One market (Nasdaq 100 CFD) and one timeframe (5 minutes). Data from January 2020 only.
- Session times were set in broker server time (New York open = 16:30). In the few weeks a year when US and European daylight saving time differ, the windows are shifted by one hour.
- If stop and target are hit inside the same 5-minute candle, the trade counts as a loss — a conservative choice.
- The broker's spread was partly recorded as zero in early years; then only the fixed 0.5 points slippage was charged.
- Three targets were tested; p-values are not corrected for that. Drawdown and profit factor of the random traders are measured in the order of the real trades, so they are approximate.
The 60-second version
This study started as a Reel. Share it with someone who is sure the smart money left them a gap.
Next in the research library
- Do fair value gaps actually work? We tested almost 100,000 No usable edge
- Can one 5-minute candle predict the next six hours? Yes — the direction carries
- Does the double top pattern actually work? Worse than random
- Do Bollinger Bands actually predict reversals? in the lab
- Does Fibonacci actually work in trading? in the lab
- Does the weather in New York actually affect the Nasdaq? in the lab