Is a high win rate bot actually safe?
We ran a classic grid bot with Martingale lot doubling on 7 years of gold prices. It won 98.9 % of its 5,757 cycles. Here is what happened to the account.
01How a grid bot works
A grid bot buys more every time price falls, and closes everything on a small bounce. It almost never closes at a loss.
A common way to build a bot with a very high win rate is a grid. The bot opens a trade. If price moves against it, it does not take the loss. It opens another trade further down, and another, and waits.
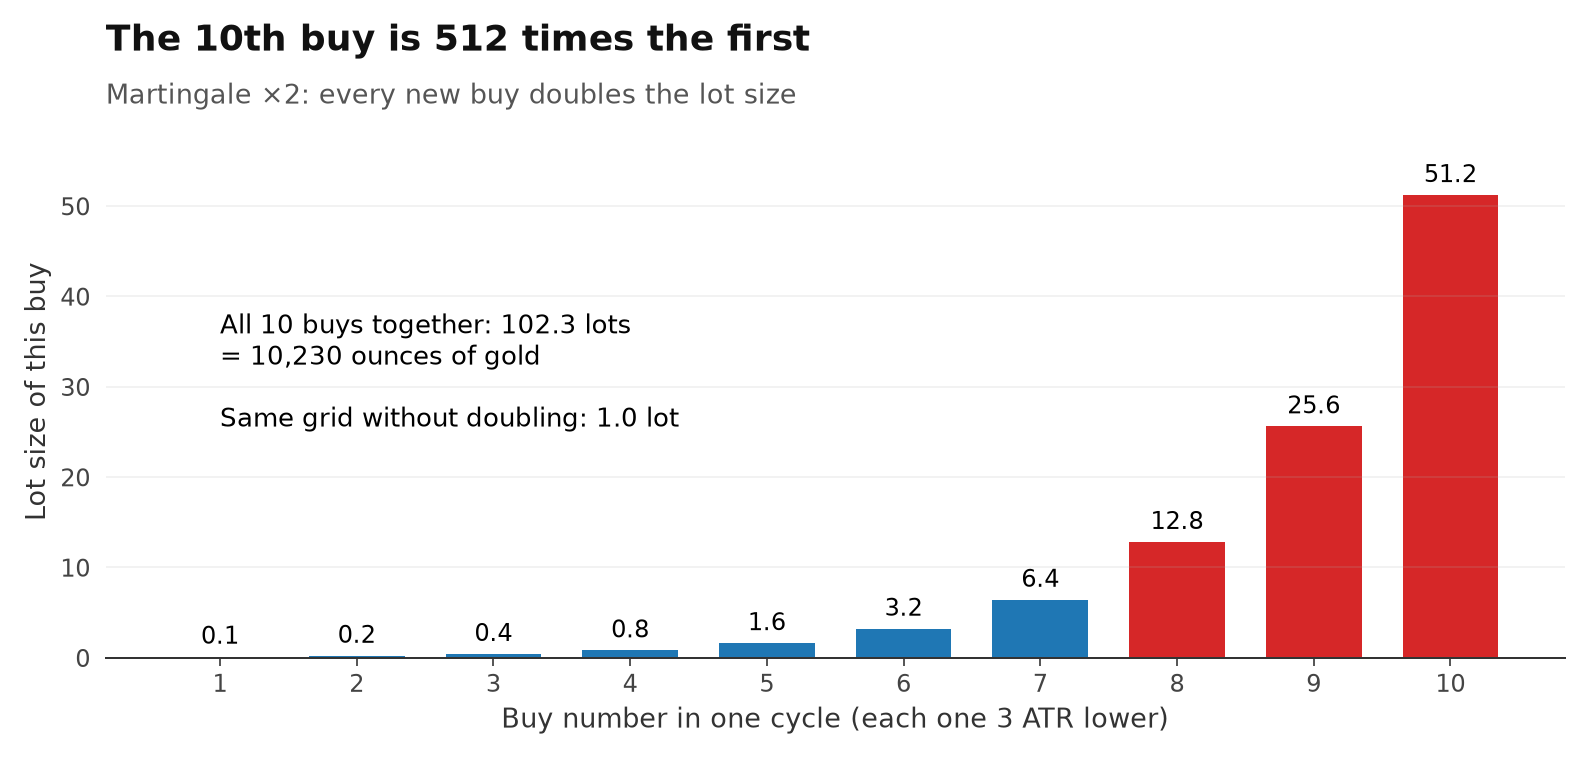
With Martingale, every new trade is twice as big as the one before. That pulls the average entry price close to the current price, so even a small bounce is enough to close the whole basket in profit.
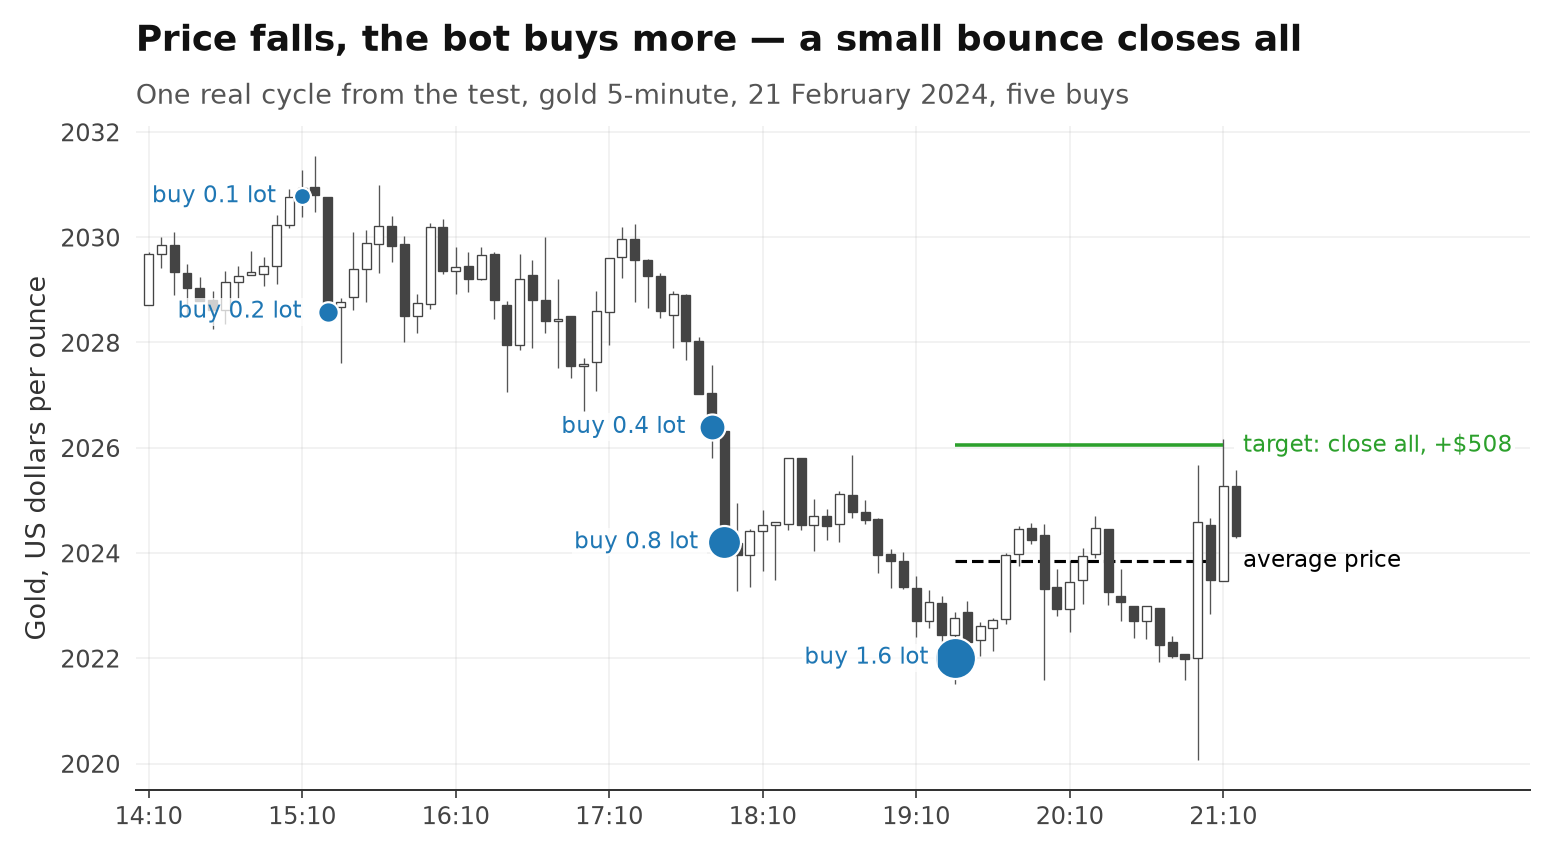
That is why the win rate is so high. The problem is the other side of the same mechanic:
02What we tested
One fixed grid bot on gold, set up in advance and never tuned — plus three variations for comparison.
| Market | Gold (XAUUSD), 5-minute candles, June 2019 – June 2026 |
|---|---|
| Start | A new cycle opens 0.1 lot at the open of the candle after the last cycle ended |
| Grid spacing | 3 × ATR (14 five-minute candles), fixed when the cycle starts |
| Adding | One more buy each time price falls one spacing further, up to 10 buys. Martingale: each new lot ×2 |
| Target | Close the whole basket when price is one spacing above the average entry price |
| Stop-loss | No stop at all. Only the broker's stop-out at 50 % margin level (leverage 1:100) |
| Account | $10,000. No new buy if margin level would fall below 100 % |
When the account fell so low that it could not even open the first 0.1 lot safely, we counted it as blown and started again with a fresh $10,000.
We ran the same rules two more ways: Martingale short instead of long, and long with the same lot size on every buy (no doubling). As a contrast we added a simple system with a stop-loss (section 9).
03How a cycle is counted
One cycle is one trade: from the first buy until the whole basket is closed.
- Win: the basket closed in profit after costs.
- Loss: the broker closed it at the stop-out level, or it was still open and under water when the data ended.
- Costs: every single order pays the real spread plus $0.50 per ounce slippage.
- Worst case: if one candle touches both a new buy and the target, the buy (and a possible stop-out) comes first.
All parameters were fixed before the test. We still split the results into 2019–2023 and 2024–2026 to see whether the picture changes over time.
04Wins against losses
The bot won 98.9 % of the time and still lost money.
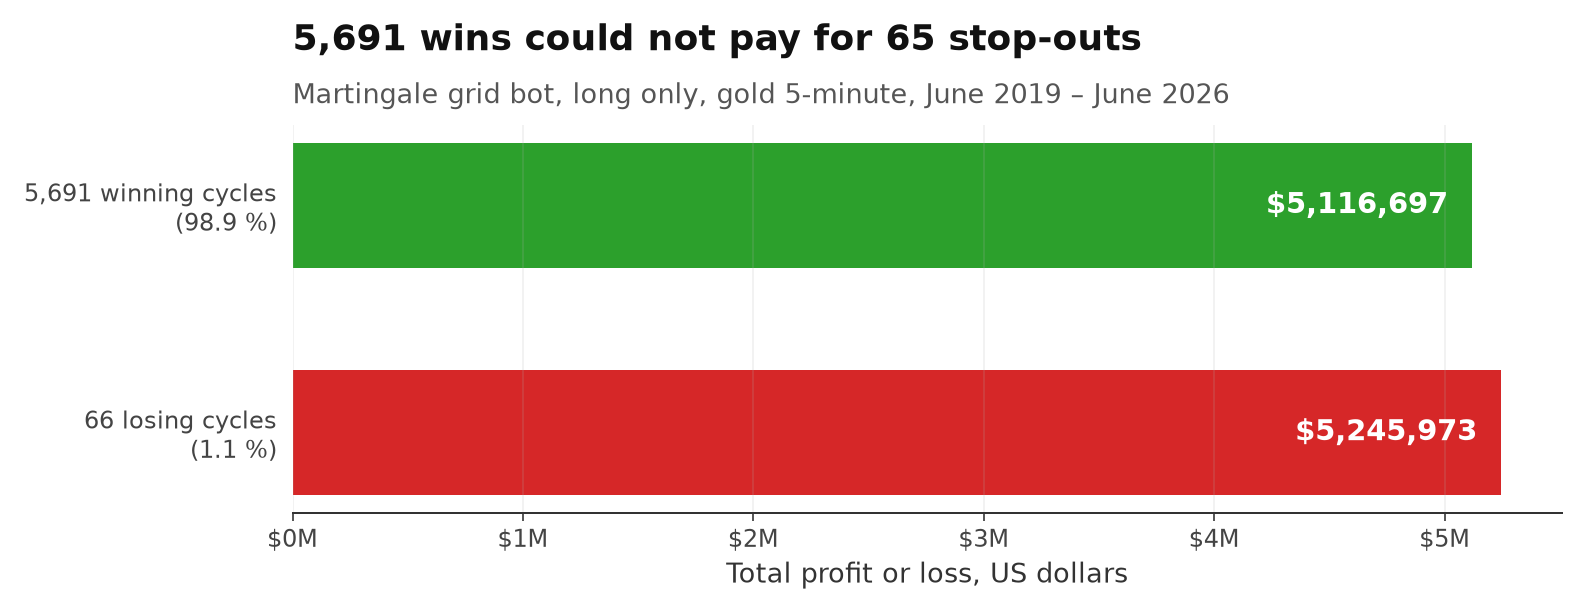
5,691 winning cycles made $5,116,697. The 66 losing cycles lost $5,245,973. Net: −$129,276.
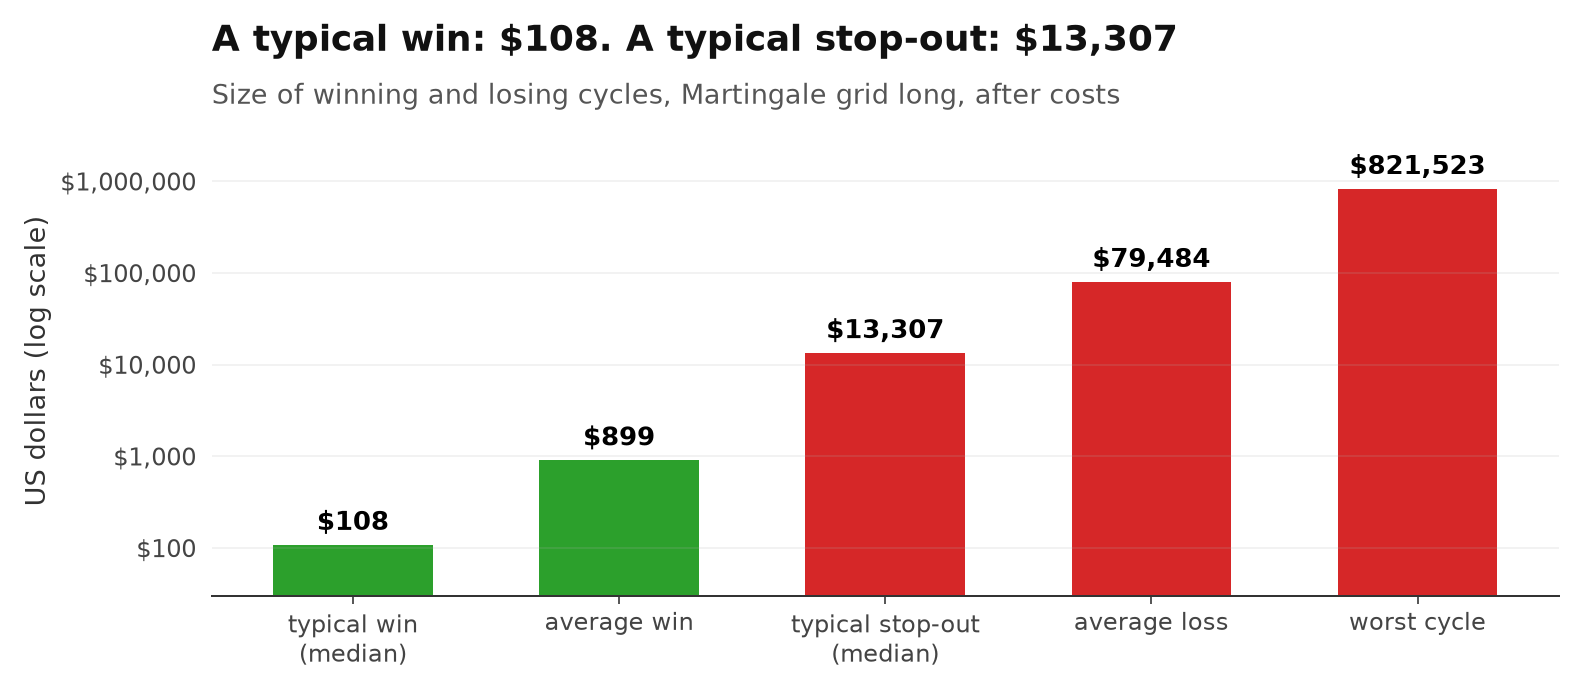
With an average win of $899 and an average loss of $79,484, a bot has to win 98.88 % of the time just to break even. This one won 98.85 %. A win rate of 98.9 % can be a losing system.
05The worst cycle
Gold fell 5.5 % in 11 days. That was enough to lose $821,523.
On 22 September 2023 the bot started a normal cycle with 0.1 lot. Gold kept sliding. The bot kept buying, doubling each time, until it held 102.3 lots — about 10,230 ounces of gold.
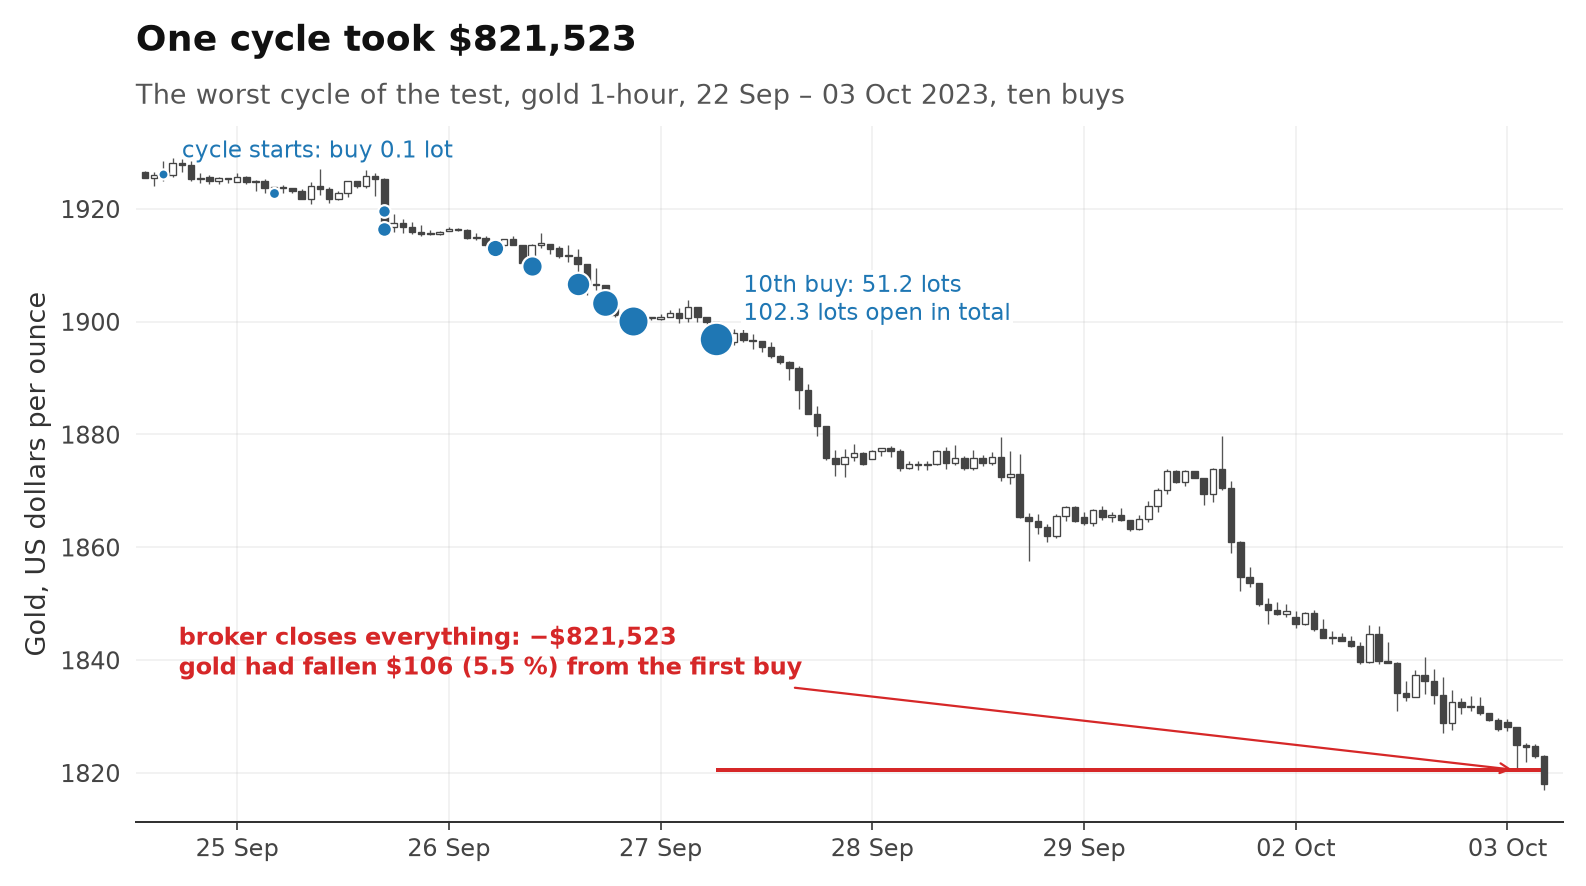
The account held $907,683 before this cycle and $86,161 after it: 90.5 % gone in one trade. That single loss equals 914 average winning cycles.
06The account
The account grew for months, then collapsed — again and again.
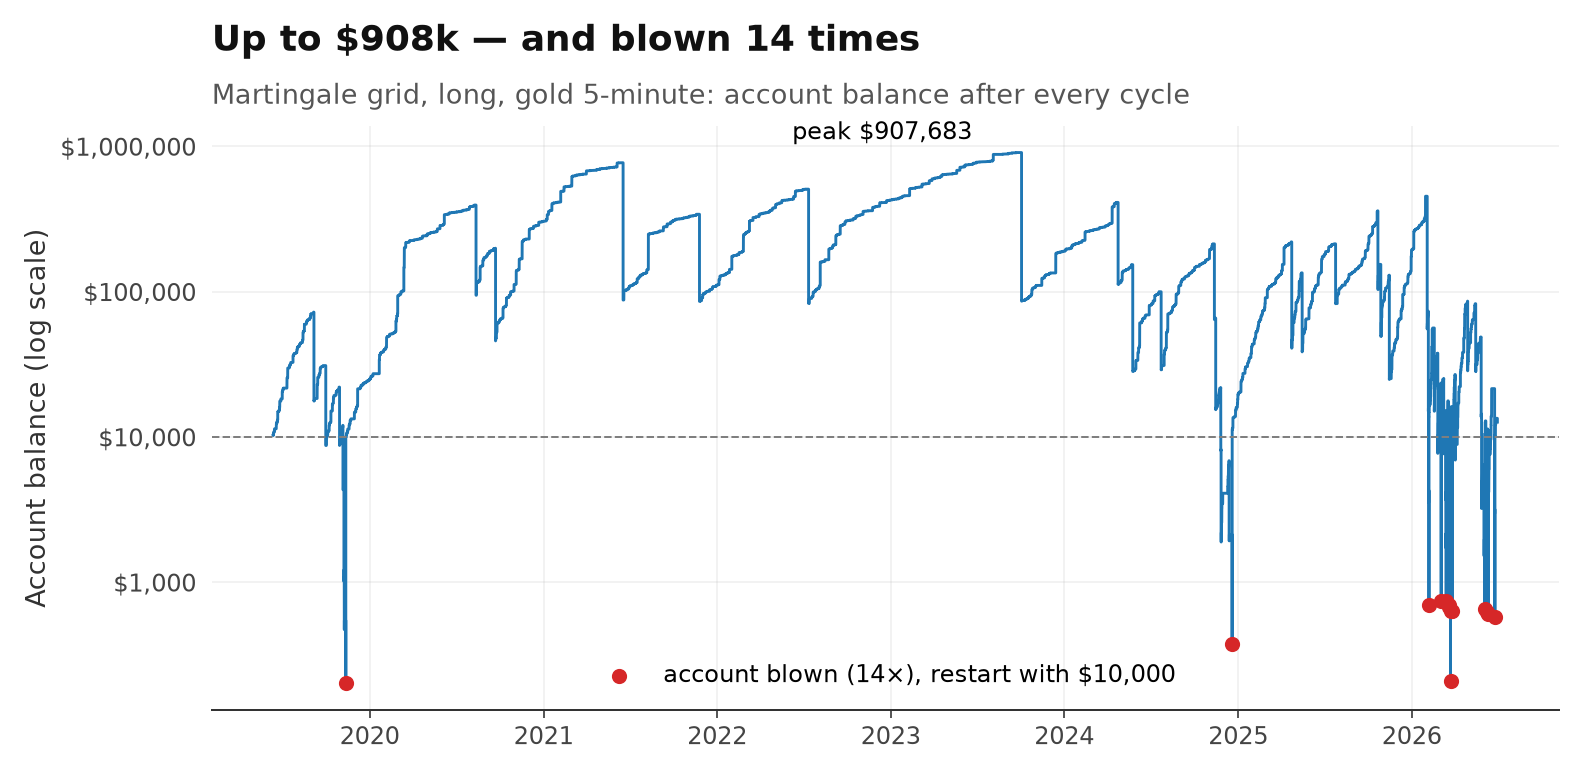
This is what makes grid bots so convincing on a short track record. For long stretches the curve only goes up. The first account was blown on 11 November 2019, 5 months in.
Over the whole test, 14 accounts were blown. Counting every top-up back to $10,000, a trader would have paid in $141,943 and been left with $12,667.
| Martingale long | Cycles | Win rate | Stop-outs | Net USD |
|---|---|---|---|---|
| 2019–2023 | 3,261 | 99.6 % | 13 | +$171,533 |
| 2024–2026 | 2,496 | 97.9 % | 52 | −$300,809 |
To be fair: measured in dollars, 2019–2023 even ended in profit, although both of the two largest losses happened then. A larger account lets the bot add more and bigger buys before the margin runs out, so wins and losses both grow with it. From 2024 on, stop-outs came far more often: 52 against 13.
07Without doubling, or short
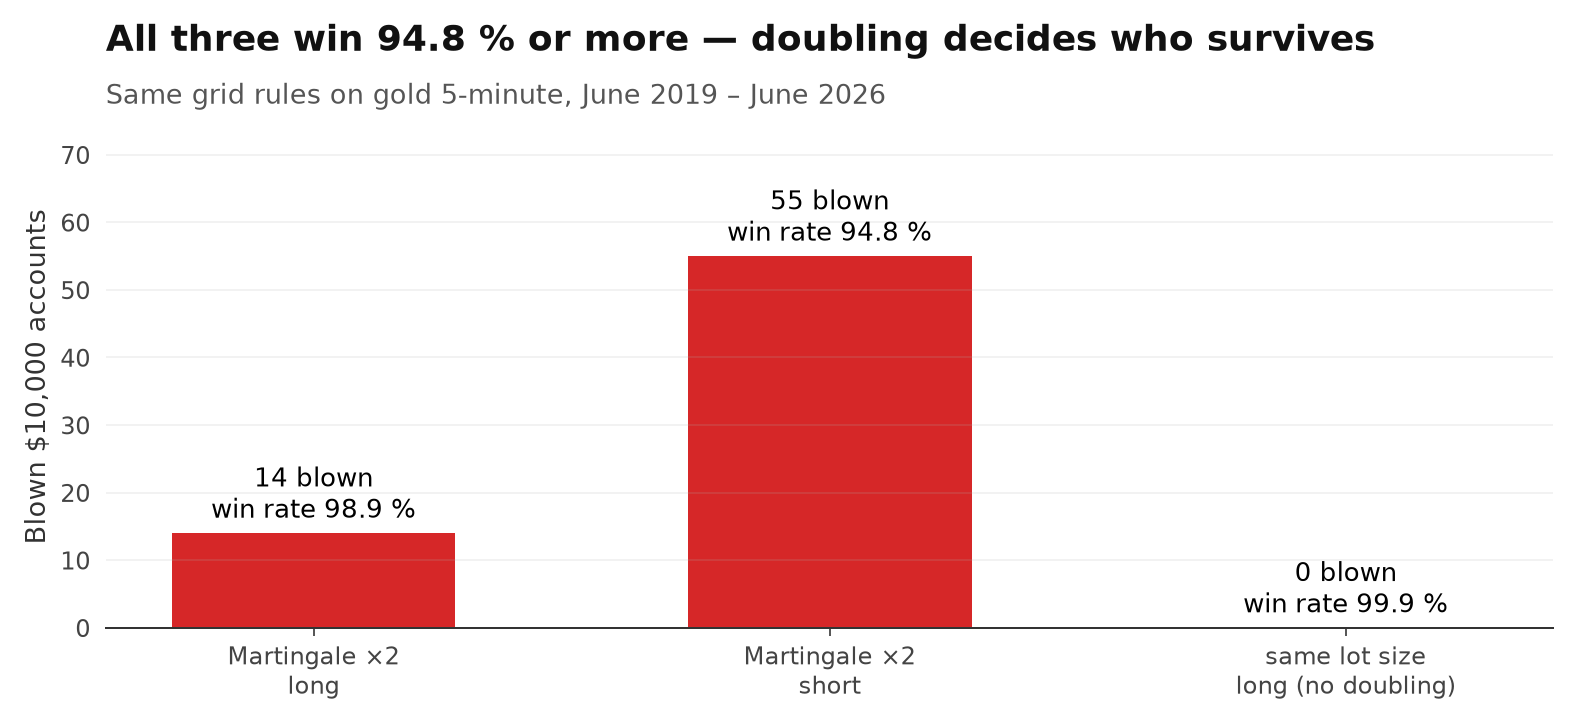
Every version won at least 94.8 % of its cycles. Only the one without doubling survived.
| Grid on gold | Cycles | Win rate | Blown | Net USD |
|---|---|---|---|---|
| Martingale ×2, long | 5,757 | 98.9 % | 14 | −$129,276 |
| Martingale ×2, short | 4,112 | 94.8 % | 55 | −$495,771 |
| Same lot size, long | 1,250 | 99.9 % | 0 | +$70,679 |
The grid without doubling ended with a profit of +$70,679 and was never stopped out. That result deserves a close look rather than a headline:
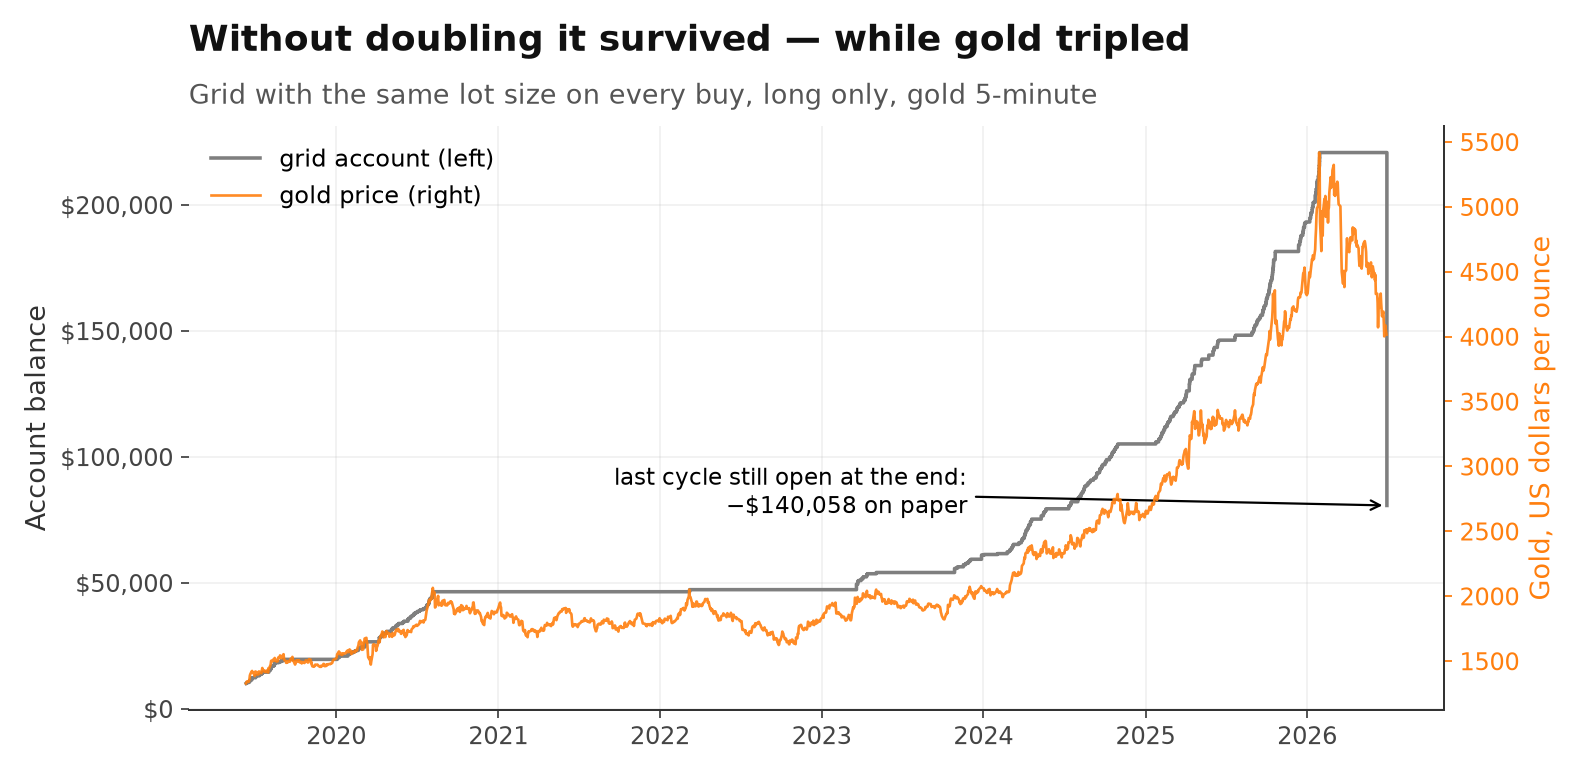
- It only buys, in a market that went up about 3-fold. The short version of the same idea blew 55 accounts.
- One cycle stayed open for 19 months (7 August 2020 to 8 March 2022) and still counted as a win.
- The last cycle, opened on 29 January 2026, was still open at the end: −$140,058 on paper, 63.5 % of the account. At its worst point the account was 78.4 % below its high.
08The random test
Compared with random direction, the long Martingale grid did worse than most random versions.
We also ran each grid with the same rules but a random direction for every cycle and a randomly shifted start — 1,000 times for the main bot, 200 times for the others. The measure is the average result per cycle.
| Grid on gold | Random runs | Better than | p-value |
|---|---|---|---|
| Martingale ×2, long | 1,000 | 9.4 % of random runs | 0.9061 |
| Martingale ×2, short | 200 | 95.0 % of random runs | 0.0547 |
| Same lot size, long | 200 | 100.0 % of random runs | 0.005 |
A p-value near 0 means random versions rarely did as well. The flat long grid "beats random" clearly — but its random versions buy and sell at random, while the real one only buys in a rising market. That is mostly the gold rally, not the grid.
09A system with a stop
A stop-loss caps the worst trade. It does not create an edge.
For contrast we tested a simple session system on the same gold data: trade in the direction of the first New York 5-minute candle (its close against a 12-period EMA), stop at 8 × ATR, trail the stop along a 120-period EMA once the trade is 0.5R in profit. One trade per day, same cost model.
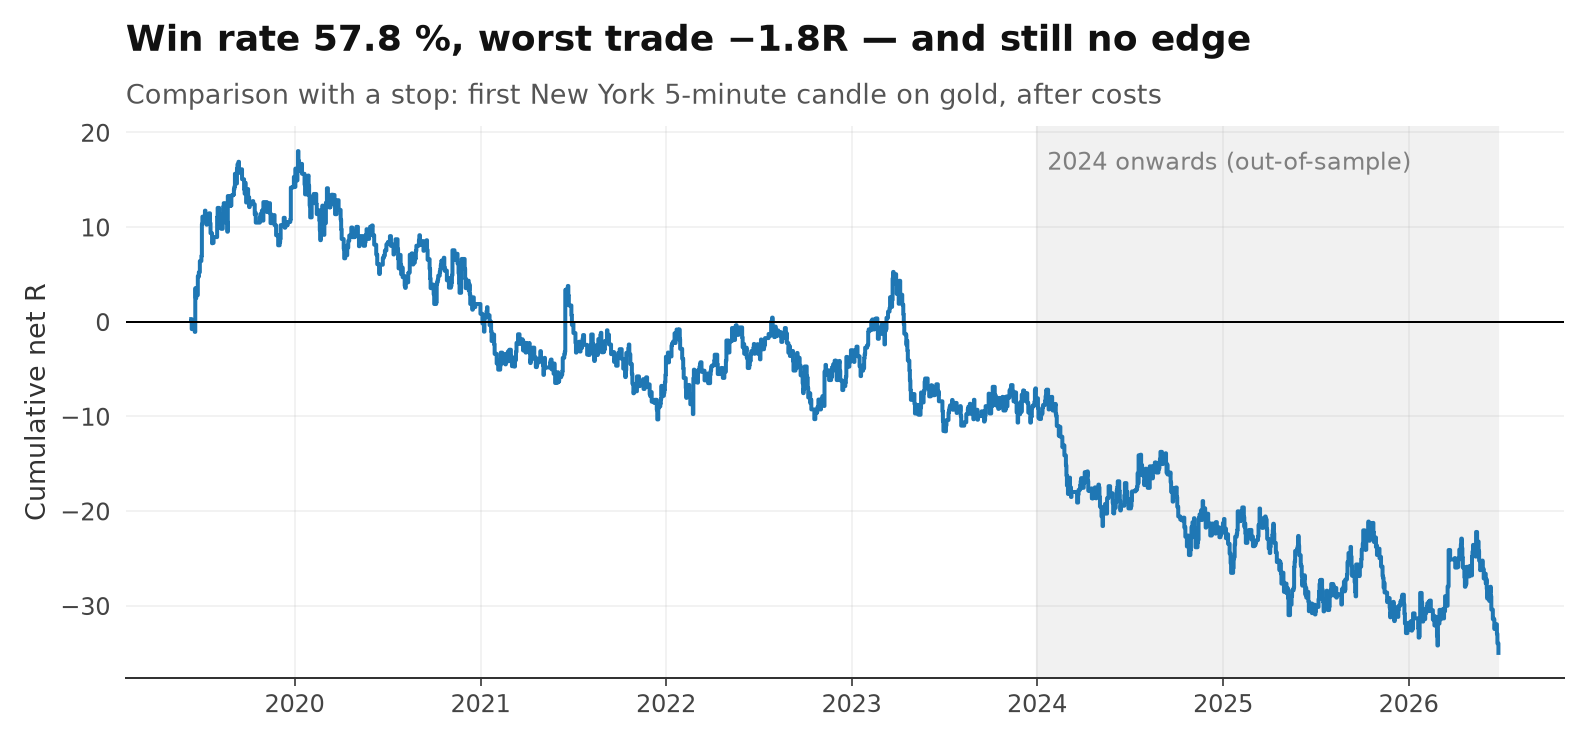
It won 57.8 % of 1,397 trades and ended at −35.0R after costs (+8.9R before). Against 200 coin-flip versions it had a p-value of 0.4279: no edge. At 1 % risk per trade its worst drawdown was 44.1 %.
So it is not a good system either. But look at the shape of its risk:
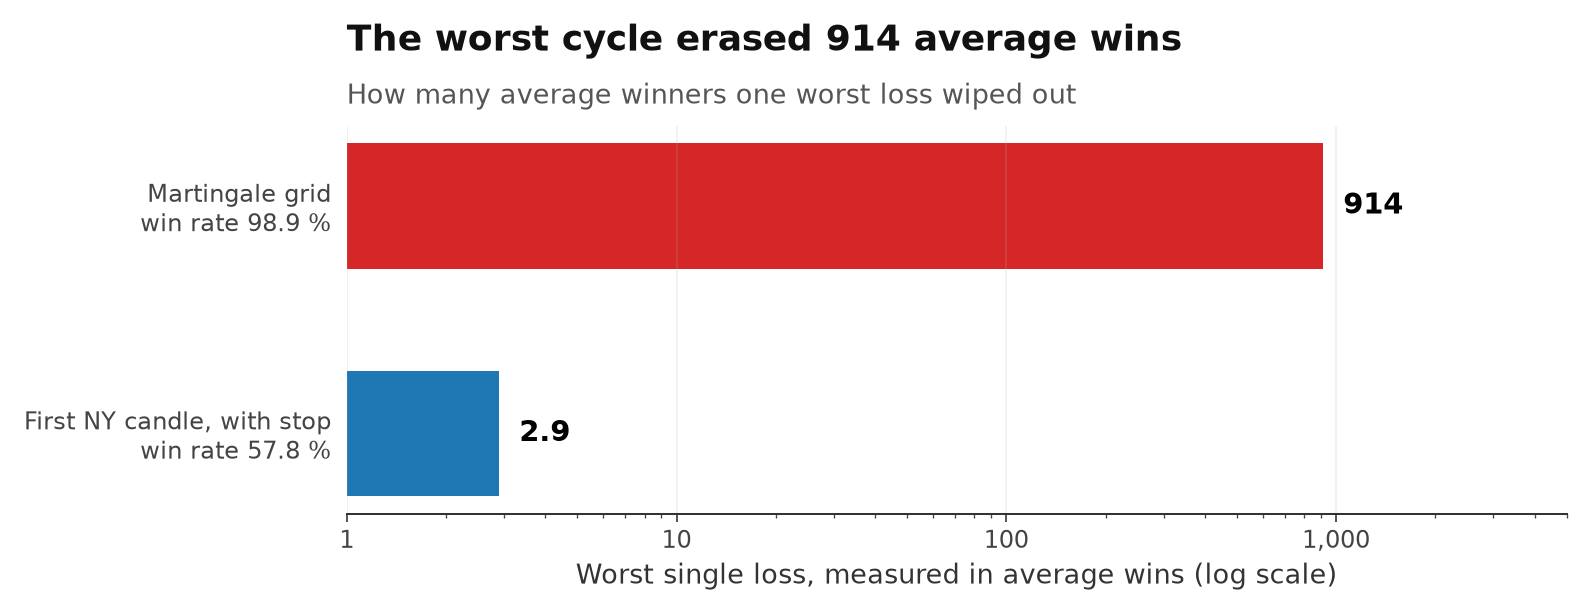
Its worst trade was −1.82R, about 2.9 average wins. The grid's worst cycle wiped out 914. With a stop, a bad system loses slowly and visibly. Without one, it looks perfect until it isn't.
10Verdict
A 98.9 % win rate came with 65 stop-outs, 14 blown accounts and a net loss of $129,276. The win rate hid the risk instead of measuring it.
A grid or Martingale bot does not remove losses. It postpones them and makes them bigger, until price moves far enough in one direction. On gold, that happened 65 times in 7 years.
Before you trust a high win rate
- Ask for the largest loss, not the win rate — and compare it with the average win.
- Ask whether there is a stop-loss. "No stop" usually means the broker's stop-out is the stop.
- Ask how long the track record is. A few good months prove little: here the first account was blown after 5 months.
Limitations
- One market, one price path (June 2019 – June 2026), dominated by a strong gold rally.
- One grid setup (3 × ATR spacing, 10 buys, ×2). Other settings were not tested.
- Overnight swap was not included. Grid positions are often held for days or months, so real results would be worse.
- Candle-based test: the order of prices inside one candle is unknown, so we assumed the worse order.
- Margin and stop-out rules (1:100, 50 %) differ between brokers.
The 60-second version
This study started as a Reel. Share it with someone who is looking at a bot with a near-perfect win rate.
Next in the research library
- Do fair value gaps actually work? We tested almost 100,000 No usable edge
- Can one 5-minute candle predict the next six hours? Yes — the direction carries
- Does the double top pattern actually work? Worse than random
- Do Bollinger Bands actually predict reversals? in the lab
- Does Fibonacci actually work in trading? in the lab
- Does the weather in New York actually affect the Nasdaq? in the lab